# Phân Tích Hiệu Suất Pool: Cách Benchmark Các Pool Stake Cardano
Khi bạn ủy quyền ADA cho một pool stake Cardano, bạn không chỉ chọn một cái tên từ danh sách — bạn đang đưa ra quyết định đầu tư. **Stake pool analysis** phân biệt những người ủy quyền kiếm được lợi nhuận ổn định với những người để tiền trên bàn. Sự khác biệt không phải là may mắn; đó là cách tiếp cận có hệ thống để đánh giá dữ liệu hiệu suất pool.
Hướng dẫn này dạy bạn cách analyze stake pool data như một chuyên gia. Bạn sẽ học cách xây dựng peer group để so sánh công chính, giải thích thống kê luck với các khoảng tin cậy thích hợp, theo dõi trend thay vì snapshot, và xây dựng mô hình chấm điểm đa chiều phù hợp với ưu tiên của bạn. Đến cuối, bạn sẽ có một framework lặp lại cho **Cardano pool analysis** hoạt động dù bạn đang ủy quyền ₳2,000 hay ₳200,000.
> **Key insight**: Protocol làm cho tất cả dữ liệu pool trở nên công khai. Lợi thế thuộc về những người ủy quyền biết cách đọc nó.
---
## Tại Sao Hầu Hết Người Ủy Quyền Phân Tích Pool Sai
Mở bất kỳ wallet hay explorer nào và bạn sẽ thấy một bảng các pool với các cột: ROA, blocks produced, fees, pledge, saturation. Hầu hết delegator sắp xếp theo ROA giảm dần, chọn pool unsaturated hàng đầu, và coi như xong.
Cách tiếp cận này thất bại vì ba lý do:
1. **ROA là chỉ số lagging** — nó cho bạn biết điều gì đã xảy ra epoch trước, không phải điều gì sẽ xảy ra epoch tiếp theo
2. **Chỉ số đơn lẻ thiếu context** — ROA 4.8% có ý nghĩa hoàn toàn khác cho pool ₳5M so với pool ₳50M
3. **Phân tích snapshot bỏ qua trajectory** — pool giảm từ 98% xuống 92% block rate trong sáu tháng là cờ đỏ ngay cả khi ROA hiện tại trông tốt
**Stake pool performance review** yêu cầu chuyển từ "con số này nói gì?" sang "pattern này cho tôi biết gì?"
---
## Xây Dựng Peer Group: Nền Tảng Của So Sánh Công Chính
Bạn sẽ không so sánh doanh thu quán cà phê góc với Starbucks. Tuy nhiên delegator thường so sánh pool ₳3M với pool ₳100M. **Cardano pool benchmarking** bắt đầu với việc xây dựng peer group hợp lệ.
### Peer Group Criteria
Một peer group có ý nghĩa chia sẻ ba đặc điểm:
| Dimension | Recommended Range | Why It Matters |
|-----------|-------------------|----------------|
| **Active Stake** | ±20% of target pool | Block production variance scales với stake |
| **Margin Band** | ±1% variable margin | Fee structure determines delegator share |
| **Geography/Relay Region** | Cùng continent/region | Latency affects block propagation success |
**Example**: Analyzing pool ₳15M với 2% margin ở Singapore? Peer group của bạn là ₳12M–₳18M, 1–3% margin, Southeast Asia relays. Không phải pool ₳150M ở Europe với 0.5% margin.
### Tools That Automate This
- **adapools.org → "Similar Pools"**: Auto-filters by stake range và margin band
- **PoolTool.io → "Peer Comparison"**: Thêm geographic relay filtering
- **Manual spreadsheet**: Export CSV từ tool nào, apply filter của bạn
> **Vietnam context**: Hầu hết delegator Việt Nam stake ₳2K–₳10K. Ở stake này, fixed fee drag chiếm ưu thế. Peer group cho small-stake delegator nên weight fixed fee nặng — chi tiết ở phần scoring.
---
## Giải Thích Luck: Signal vs Noise
**Luck** = (Actual Blocks / Expected Blocks) × 100%. Đây là metric bị hiểu sai nhiều nhất trong staking.
### The Statistical Reality
Slot leadership tuân theo binomial distribution. Với pool có 0.1% total stake:
- Expected blocks per epoch: ~21
- Standard deviation: ~4.5 blocks
- 95% confidence interval: ±9 blocks (~±43% luck)
**Luck của một epoch đơn lẻ là vô nghĩa thống kê cho pool dưới ₳50M.**
### Practical Thresholds
| Epochs Observed | 95% CI Width | Actionable? |
|-----------------|--------------|-------------|
| 1–5 epochs | ±50–100% | Không — pure noise |
| 12–24 epochs (3–6 tháng) | ±15–25% | Weak signal only |
| 50+ epochs (≈250 days) | ±8–12% | **Yes — meaningful** |
| 100+ epochs | ±5–8% | **Strong signal** |
### How to Use Luck in Analysis
1. **Require ≥50 epochs** trước khi weight luck trong decisions
2. **Flag chronic underperformance**: Lifetime luck <90% với ≥50 epochs = operational issue
3. **Ignore recent luck swings**: Pool ₳5M hitting 200% luck một epoch và 60% epoch sau là normal variance
4. **Cross-reference with block rate**: Luck ≠ block rate. Pool có thể có 100% luck nhưng 85% block rate (produced fewer blocks than assigned due to downtime)
> **Contrarian note**: Một số SPOs argue luck là "vanity metric" — block rate (produced/assigned) là operational metric duy nhất quan trọng. Cho delegation decisions, dùng cả hai: block rate cho operations, luck cho honesty verification.
---
## Trend Analysis: The 3-Window Framework
Snapshot analysis hỏi "Pool này đang thế nào *bây giờ*?" Trend analysis hỏi "Pool này đang đi *đâu*?"
### Three Rolling Windows
| Window | Epochs | ~Days | What It Reveals |
|--------|--------|-------|-----------------|
| **Short** | 3 | 15 | Acute issues (key rotation failure, relay outage) |
| **Medium** | 12 | 60 | Seasonal patterns, fee changes, infrastructure upgrades |
| **Long** | 50 | 250 | Structural trajectory (improving, stable, declining) |
### Key Trends to Track
**Block Rate Trend**
```
3-epoch avg: 97% → 12-epoch avg: 95% → 50-epoch avg: 96%
```
Stable. Nhưng nếu 3-epoch drop xuống 90% trong khi 50-epoch giữ ở 96% → investigate immediately.
**Stake Growth Trend**
```
Monthly stake change: +2% → +5% → +8%
```
Accelerating growth = saturation risk approaching. Calculate **Saturation Buffer**:
```
Saturation Buffer = (Saturation Point - Live Stake) / Saturation Point
```
Ở 85% saturation với +5%/month growth → saturation trong ~3 tháng. Plan your exit.
**Fee Stability Trend**
```
Margin history: 2% → 2% → 2% → 3% → 3% → 4%
```
Creeping margin increases signal operator extracting more value. Fixed fee jumps (₳340 → ₳500 → ₳1000) thậm chí còn hại hơn cho small delegator.
**Operator Behavior Trend**
- Pledge increasing? → Operator reinvesting (positive)
- Relay count growing? → Infrastructure investment (positive)
- Communication frequency dropping? → Silent operator risk (negative)
- Key rotation incidents? → Technical debt accumulating (negative)
---
## Multi-Dimensional Scoring: Build Your Own Model
Không single score fit all delegator. Tax-sensitive whale wants minimum margin. Decentralization advocate wants small pool với high pledge. Risk-averse retail user wants maximum block rate.
### The Customizable Scoring Framework
| Metric | Weight Range | Conservative | Yield-Focused | Decentralization |
|--------|--------------|--------------|---------------|------------------|
| Block Rate (50-epoch) | 20–40% | 35% | 20% | 25% |
| Lifetime Luck (50+ epochs) | 10–20% | 15% | 10% | 10% |
| Variable Margin | 15–25% | 15% | 30% | 15% |
| Fixed Fee Impact* | 10–20% | 20% | 15% | 15% |
| Saturation Buffer | 10–15% | 10% | 10% | 15% |
| Pledge Ratio | 5–15% | 5% | 5% | 20% |
| Operator Reliability | 10–20% | 20% | 10% | 10% |
*Fixed Fee Impact = (Fixed Fee / Your Stake) × (1 - Margin) — calculate for YOUR stake amount
### Scoring Each Dimension (0–100 Scale)
**Block Rate**: 98%+ = 100, 95% = 80, 90% = 50, <90% = 0
**Luck**: 95–105% = 100, 90–110% = 80, 85–115% = 60, <85% = 0
**Margin**: 0–1% = 100, 1–2% = 85, 2–3% = 70, 3–5% = 50, >5% = 0
**Saturation Buffer**: >50% = 100, 30–50% = 80, 10–30% = 50, <10% = 0
**Pledge Ratio**: >5% = 100, 2–5% = 80, 1–2% = 60, <1% = 30
### Example: Scoring Three Pools for a ₳5,000 Delegator
| Metric | Pool A (₳12M, 2%, ₳200K pledge) | Pool B (₳45M, 1.5%, ₳500K pledge) | Pool C (₳8M, 3%, ₳50K pledge) |
|--------|----------------------------------|-----------------------------------|-------------------------------|
| Block Rate (97%) | 90 | 95 | 85 |
| Luck (102%) | 100 | 100 | 90 |
| Margin (2%/1.5%/3%) | 70 | 85 | 50 |
| Fixed Fee Drag (₳340/₳5K) | 45 | 45 | 45 |
| Saturation Buffer (85%/30%/90%) | 50 | 80 | 100 |
| Pledge Ratio (1.7%/1.1%/0.6%) | 80 | 80 | 60 |
| Operator Reliability | 85 | 90 | 70 |
| **Conservative Weighted** | **78** | **82** | **68** |
| **Yield-Focused Weighted** | **72** | **85** | **62** |
Pool B wins cho cả hai profiles. Pool C's high margin và low pledge drag it down despite good saturation buffer.
> **Vietnam insight**: Cho ₳2K stakes, Fixed Fee Drag = (340/2000) × 0.98 = **16.7% effective margin**. 2% variable margin pool effectively charges ~18.7%. Tại ₳10K, là ~5.3%. Small delegator nên weight fixed fee 2x higher.
---
## Operator Behavior Patterns: The Hidden Predictor
Historical metrics cho bạn biết *what happened*. Operator behavior cho bạn biết *what will happen*.
### The Operator Reliability Score (40/30/30)
**40% Operational Track Record**
- 50-epoch block rate trend (improving/stable/declining)
- Zero missed slots in last 12 epochs = +20
- Key rotation completed on time last 3 cycles = +15
- Relay count ≥3 with geographic diversity = +15
- Monitoring/alerting evidence (status page, Twitter updates) = +10
**30% Behavioral Signals**
- Fee changes: 0 changes in 12 months = +20, 1 change = +10, >1 = 0
- Pledge trajectory: Increasing = +20, Stable = +10, Decreasing = 0
- Communication: Weekly updates = +20, Monthly = +10, Silent >60 days = -20
- Infrastructure investment: New relays, hardware upgrades = +15
**30% Transparency & Accountability**
- Doxxed or reputable pseudo-anon identity = +20
- Public incident postmortems = +20
- Open-source tooling contributions (CNTools, guild scripts, APIs) = +15
- Community engagement (Telegram/Discord responsive) = +15
- Audit reports (SPOCRA, Guild) = +20
### Red Flags (Auto-Disqualify)
- ❌ Anonymous operator + no audit + silent >90 days
- ❌ Margin increased >2x in 6 months
- ❌ Pledge dropped to near-zero
- ❌ Key rotation failure in last 12 months
- ❌ Relay count dropped below 2
- ❌ Pool saturated + no sister pool announced
---
## Analyzing Stake Pool Data: Step-by-Step Workflow
Đây là quy trình **analyze stake pool data** có thể lặp lại:
### Step 1: Define Your Delegator Profile (5 minutes)
- Stake amount: ₳____
- Priority: Conservative / Yield / Decentralization / Balanced
- Switching tolerance: Willing to move annually / quarterly / monthly
- Tax sensitivity: High (minimize taxable events) / Low
### Step 2: Initial Screen (10 minutes)
1. Export pool list từ adapools.org hoặc PoolTool.io (CSV)
2. Filter: Unsaturated (<90% saturation), Margin ≤5%, Block rate ≥90%
3. Result: 50–200 pools depending on filters
### Step 3: Peer Group Construction (10 minutes)
1. Identify 3–5 candidate pools
2. For each, build peer group (±20% stake, ±1% margin, same region)
3. Calculate peer group averages cho block rate, luck, fees
### Step 4: Deep Dive on Top 3 (20 minutes per pool)
1. **50-epoch trend charts**: Block rate, luck, stake, fees
2. **Operator profile**: Fee history, pledge history, relay changes, communication
3. **Saturation buffer projection**: Months to saturation at current growth
4. **Fixed fee drag calculation** for YOUR stake amount
5. **Score using your weighted model**
### Step 5: Test Delegate (1 epoch = 5 days)
1. Delegate small amount (₳100–₳1000) to top choice
2. Verify rewards received match estimates
3. Confirm wallet UX, tax reporting compatibility
### Step 6: Full Delegation + Monitoring Setup
1. Delegate full amount
2. Set PoolTool webhook alerts for: missed slots, fee changes, saturation breach
3. Calendar reminder: Monthly 5-minute review (block rate, stake trend, fee check)
---
## Comparative Analysis: adapools.org vs PoolTool.io for Analysis
| Analysis Task | Best Tool | Why |
|---------------|-----------|-----|
| Peer group building | adapools.org | "Similar Pools" one-click, clean UI |
| Trend charts (12+ months) | PoolTool.io | Granular historical data, exportable |
| Block-by-block timeline | PoolTool.io | Slot-level detail, orphaned block visibility |
| Mobile quick-check | adapools.org | Native iOS/Android app, push alerts |
| Operator deep-dive | PoolTool.io | Relay monitoring, infrastructure detail |
| Custom scoring | Both → Export CSV → Spreadsheet | Neither has customizable weighting |
**Pro workflow**: Use adapools for screening → PoolTool for deep dive → Spreadsheet for scoring.
---
## Advanced: Multi-Pool Strategy with Analytical Rigor
For stakes >₳100K, single-pool delegation concentrates risk. But splitting randomly reduces analytical clarity.
### Analytical Multi-Pool Framework
1. **Define pool roles** (not just "split evenly"):
- **Core** (60%): Highest-scoring pool by your model
- **Hedge** (25%): Different operator, different geography, different relay provider
- **Satellite** (15%): Small pool (<₳10M) với high pledge, supporting decentralization
2. **Correlation check**: Ensure pools don't share:
- Same relay provider (AWS region, data center)
- Same operator (even pseudo-anon)
- Same jurisdiction (regulatory risk)
3. **Rebalancing rule**: Quarterly review. Rebalance if:
- Any pool's score drops >15 points
- Saturation buffer <20% on any pool
- New pool enters peer group scoring >10 points higher
---
## FAQ
### How do I compare two stake pools statistically?
Build a peer group for each, then compare each pool to its own peer group average (z-score). A pool at +1.5σ on block rate in its peer group is outperforming; at -1.5σ it's underperforming. Never compare raw metrics across different stake tiers.
### What time period is meaningful for pool analysis?
**Minimum 50 epochs (~250 days)** for luck và block rate confidence. For trend analysis, use the 3-window framework: 3-epoch (acute), 12-epoch (medium), 50-epoch (structural). Daily/weekly checks are noise.
### How to build a peer group for benchmarking?
Filter pools by: active stake ±20%, variable margin ±1%, geographic relay region. Tools: adapools.org "Similar Pools", PoolTool.io "Peer Comparison", or manual CSV filter. For stakes <₳5M, peer groups don't exist — use absolute thresholds instead.
### When is luck statistically significant vs noise?
At 1 epoch: never significant. At 12 epochs: weak signal (±20% CI). At 50 epochs: meaningful (±10% CI). At 100 epochs: strong (±7% CI). Require ≥50 epochs and luck <90% or >110% to flag.
### What tools automate pool performance analysis?
- **adapools.org**: Screening, peer groups, mobile alerts
- **PoolTool.io**: Deep historical analysis, operator infrastructure, webhooks
- **cardanoscan.io / cexplorer.io**: Alternative data views, API access
- **Custom**: Export CSV → Python/R spreadsheet for custom scoring models
### How does fixed fee affect small delegators disproportionately?
**Fixed Fee Drag = (Fixed Fee / Your Stake) × (1 - Margin)**. At ₳2K stake với ₳340 fee và 2% margin: 16.7% effective drag. At ₳100K: 0.33%. Small delegators should prioritize pools with ₳340 fixed fee (protocol minimum) và weight this 2x in scoring.
### Can I automate my monthly pool review?
Yes. PoolTool.io webhooks → Telegram/Discord/email for: missed slot events, fee change announcements, saturation threshold breach (set at 85%), stake growth acceleration. Calendar reminder for manual 5-minute scorecard review.
---
## Summary: Your Analysis Checklist
Before delegating, complete this analytical review:
- [ ] **Delegator profile defined** (stake amount, priority, switching tolerance)
- [ ] **Peer groups built** for 3–5 candidate pools (±20% stake, ±1% margin)
- [ ] **50-epoch trends reviewed** (block rate, luck, stake, fees) — no declining trajectories
- [ ] **Custom score calculated** with your weighted model
- [ ] **Fixed fee drag computed** for YOUR stake amount
- [ ] **Saturation buffer projected** (>3 months runway)
- [ ] **Operator reliability scored** (40/30/30 framework) — no red flags
- [ ] **Test delegation completed** (1 epoch, rewards verified)
- [ ] **Monitoring alerts configured** (missed slots, fee changes, saturation)
- [ ] **Calendar reminder set** (monthly 5-minute review)
---
*Pool performance analysis isn't a one-time task — it's a discipline. The data is public. The tools are free. The framework is repeatable. The only variable is whether you'll use it.*
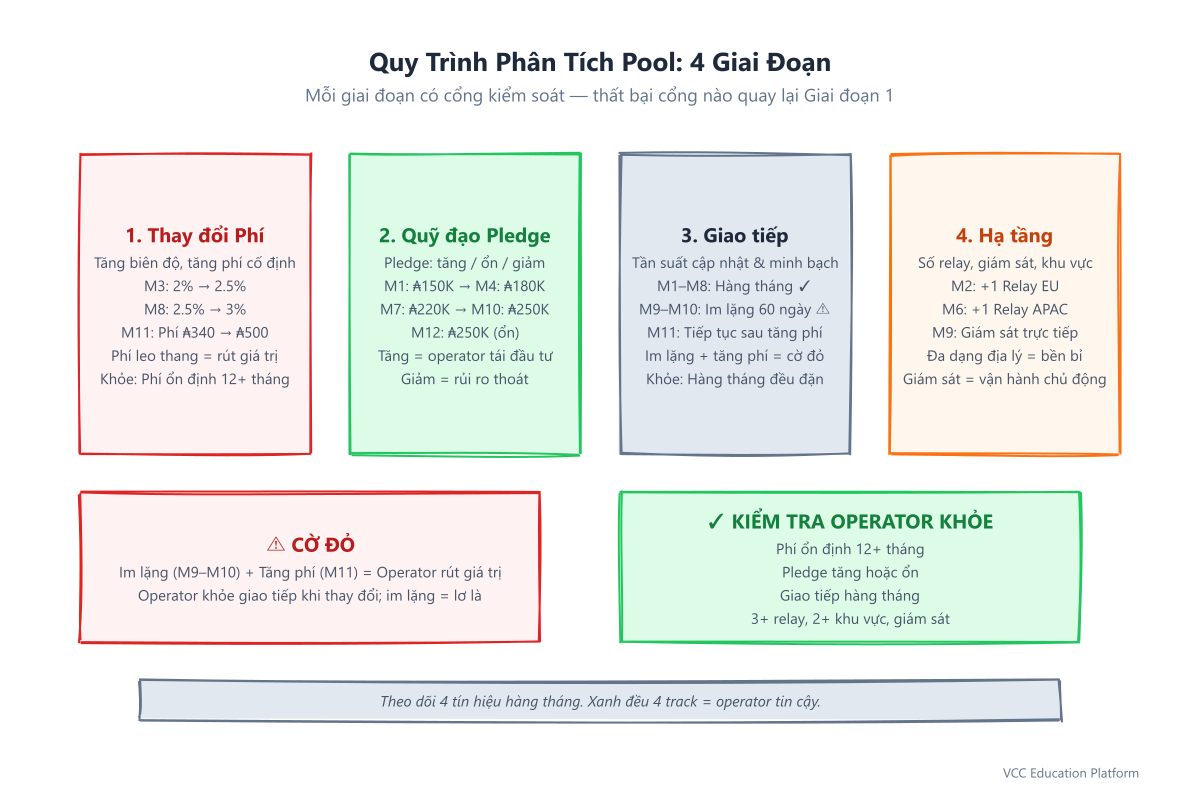
Hình 1: Quy trình 4 giai đoạn với 3 cổng kiểm soát — bất kỳ cổng nào thất bại đều quay lại Giai đoạn 1
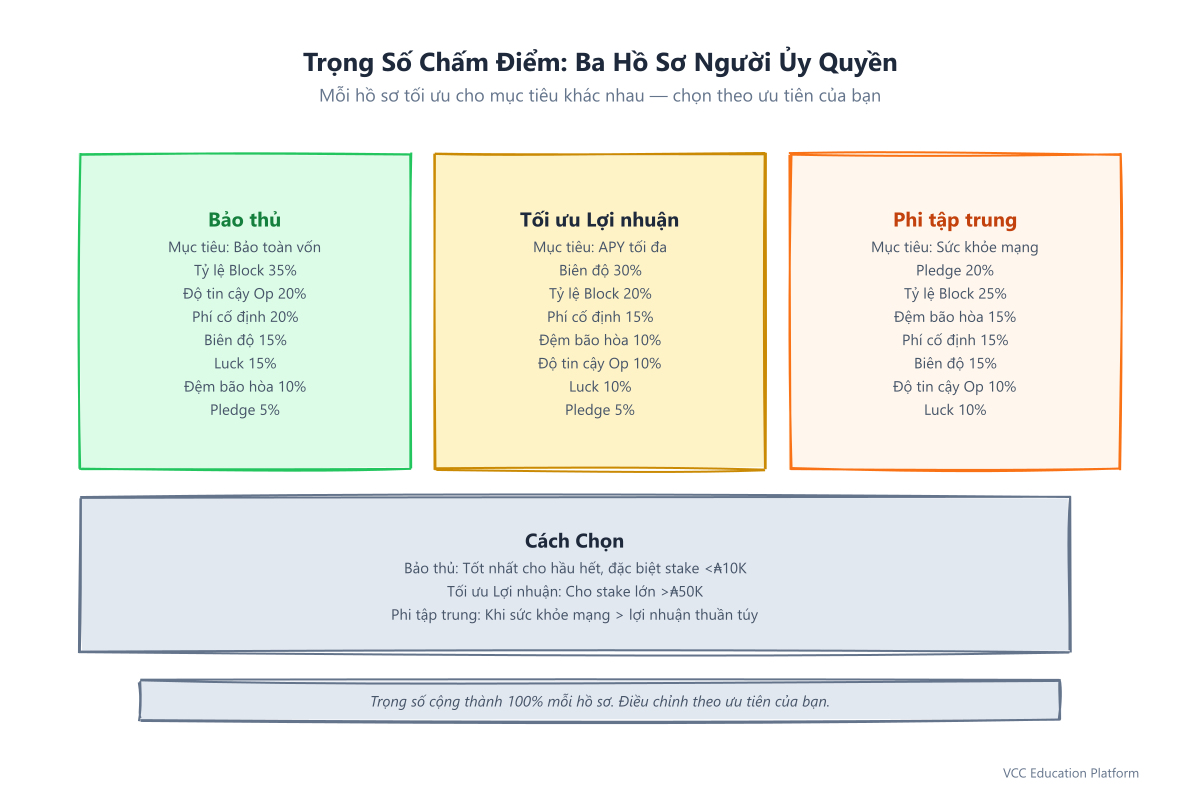
Hình 2: Ba hồ sơ người ủy quyền — Bảo thủ ưu tiên tỷ lệ block & độ tin cậy; Lợi nhuận ưu tiên phí thấp; Phi tập trung ưu tiên pledge & đệm bão hòa
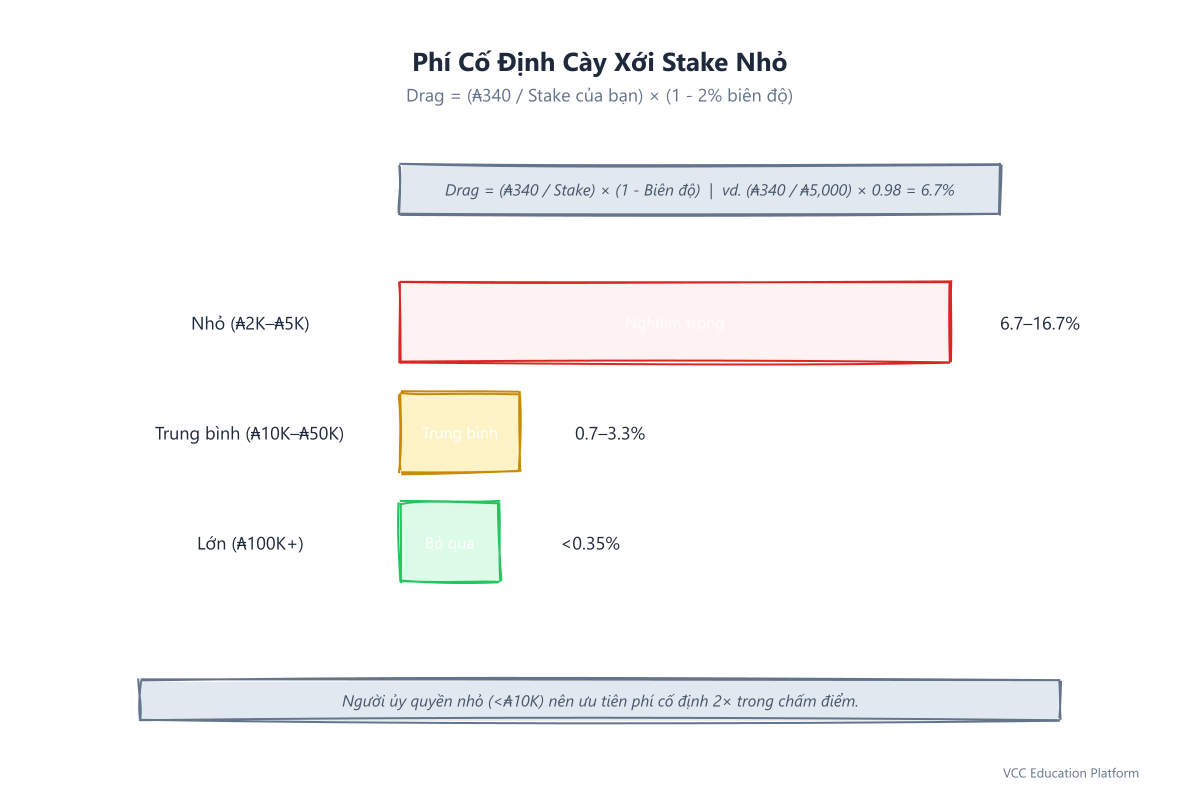
Hình 3: Phí cố định ₳340 gây tổn hại 16.7% ở ₳2K, 6.7% ở ₳5K, chỉ 0.33% ở ₳100K — người ủy quyền nhỏ cần ưu tiên phí cố định 2×
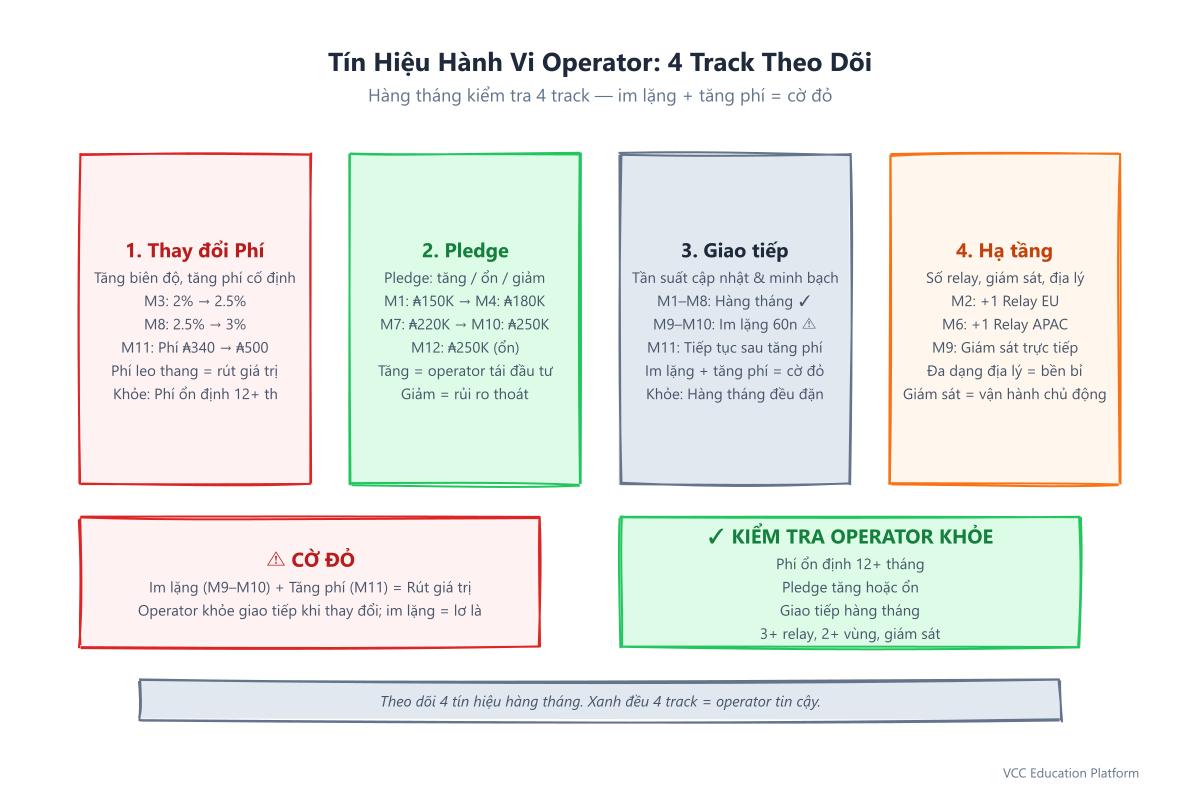
Hình 4: 4 tín hiệu theo dõi hàng tháng — Silent period (M9–M10) + Fee hike (M11) = Cờ đỏ; Xanh đều = operator tin cậy
