# Pool Performance Analysis: How to Benchmark Cardano Stake Pools
When you delegate ADA to a Cardano stake pool, you're not just picking a name from a list — you're making an investment decision. **Stake pool analysis** separates delegators who earn consistent returns from those who leave money on the table. The difference isn't luck; it's a systematic approach to evaluating pool performance data.
This guide teaches you how to analyze stake pool data like a professional. You'll learn to build peer groups for fair comparison, interpret luck statistics with proper confidence intervals, track trends instead of snapshots, and construct a multi-dimensional scoring model tailored to your priorities. By the end, you'll have a repeatable framework for **Cardano pool analysis** that works whether you're delegating ₳2,000 or ₳200,000.
> **Key insight**: The protocol makes all pool data public. The edge goes to delegators who know how to read it.
---
## Why Most Delegators Analyze Pools Wrong
Open any wallet or explorer and you'll see a table of pools with columns: ROA, blocks produced, fees, pledge, saturation. Most delegators sort by ROA descending, pick the top unsaturated pool, and call it done.
This approach fails for three reasons:
1. **ROA is a lagging indicator** — it tells you what happened last epoch, not what will happen next epoch
2. **Single metrics lack context** — a 4.8% ROA means something completely different for a ₳5M pool vs a ₳50M pool
3. **Snapshot analysis ignores trajectory** — a pool declining from 98% to 92% block rate over six months is a red flag even if current ROA looks fine
**Stake pool performance review** requires moving from "what does this number say?" to "what does this pattern tell me?"
---
## Building a Peer Group: The Foundation of Fair Comparison
You wouldn't compare a corner coffee shop's revenue to Starbucks. Yet delegators routinely compare a ₳3M pool to a ₳100M pool. **Cardano pool benchmarking** starts with constructing a valid peer group.
### Peer Group Criteria
A meaningful peer group shares three characteristics:
| Dimension | Recommended Range | Why It Matters |
|-----------|-------------------|----------------|
| **Active Stake** | ±20% of target pool | Block production variance scales with stake |
| **Margin Band** | ±1% variable margin | Fee structure determines delegator share |
| **Geography/Relay Region** | Same continent/region | Latency affects block propagation success |
**Example**: Analyzing a ₳15M pool with 2% margin in Singapore? Your peer group is ₳12M–₳18M, 1–3% margin, Southeast Asia relays. Not a ₳150M pool in Europe with 0.5% margin.
### Tools That Automate This
- **adapools.org → "Similar Pools"**: Auto-filters by stake range and margin band
- **PoolTool.io → "Peer Comparison"**: Adds geographic relay filtering
- **Manual spreadsheet**: Export CSV from either tool, apply your own filters
> **Vietnam context**: Most Vietnamese delegators stake ₳2K–₳10K. At these stakes, fixed fee drag dominates. A peer group for small-stake delegators should weight fixed fee heavily — more on this in the scoring section.
---
## Interpreting Luck: Signal vs Noise
**Luck** = (Actual Blocks / Expected Blocks) × 100%. It's the most misunderstood metric in staking.
### The Statistical Reality
Slot leadership follows a binomial distribution. For a pool with 0.1% of total stake:
- Expected blocks per epoch: ~21
- Standard deviation: ~4.5 blocks
- 95% confidence interval: ±9 blocks (~±43% luck)
**A single epoch's luck is statistically meaningless for pools under ₳50M.**
### Practical Thresholds
| Epochs Observed | 95% CI Width | Actionable? |
|-----------------|--------------|-------------|
| 1–5 epochs | ±50–100% | No — pure noise |
| 12–24 epochs (3–6 months) | ±15–25% | Weak signal only |
| 50+ epochs (≈250 days) | ±8–12% | **Yes — meaningful** |
| 100+ epochs | ±5–8% | **Strong signal** |
### How to Use Luck in Analysis
1. **Require ≥50 epochs** before weighting luck in decisions
2. **Flag chronic underperformance**: Lifetime luck <90% with ≥50 epochs = operational issue
3. **Ignore recent luck swings**: A ₳5M pool hitting 200% luck one epoch and 60% the next is normal variance
4. **Cross-reference with block rate**: Luck ≠ block rate. A pool can have 100% luck but 85% block rate (produced fewer blocks than assigned due to downtime)
> **Contrarian note**: Some SPOs argue luck is a "vanity metric" — block rate (produced/assigned) is the only operational metric that matters. For delegation decisions, use both: block rate for operations, luck for honesty verification.
---
## Trend Analysis: The 3-Window Framework
Snapshot analysis asks "How is this pool doing *now*?" Trend analysis asks "Where is this pool *going*?"
### Three Rolling Windows
| Window | Epochs | ~Days | What It Reveals |
|--------|--------|-------|-----------------|
| **Short** | 3 | 15 | Acute issues (key rotation failure, relay outage) |
| **Medium** | 12 | 60 | Seasonal patterns, fee changes, infrastructure upgrades |
| **Long** | 50 | 250 | Structural trajectory (improving, stable, declining) |
### Key Trends to Track
**Block Rate Trend**
```
3-epoch avg: 97% → 12-epoch avg: 95% → 50-epoch avg: 96%
```
Stable. But if 3-epoch drops to 90% while 50-epoch holds at 96% → investigate immediately.
**Stake Growth Trend**
```
Monthly stake change: +2% → +5% → +8%
```
Accelerating growth = saturation risk approaching. Calculate **Saturation Buffer**:
```
Saturation Buffer = (Saturation Point - Live Stake) / Saturation Point
```
At 85% saturation with +5%/month growth → saturation in ~3 months. Plan your exit.
**Fee Stability Trend**
```
Margin history: 2% → 2% → 2% → 3% → 3% → 4%
```
Creeping margin increases signal operator extracting more value. Fixed fee jumps (₳340 → ₳500 → ₳1000) are even more damaging for small delegators.
**Operator Behavior Trend**
- Pledge increasing? → Operator reinvesting (positive)
- Relay count growing? → Infrastructure investment (positive)
- Communication frequency dropping? → Silent operator risk (negative)
- Key rotation incidents? → Technical debt accumulating (negative)
---
## Multi-Dimensional Scoring: Build Your Own Model
No single score fits all delegators. A tax-sensitive whale wants minimum margin. A decentralization advocate wants small pools with high pledge. A risk-averse retail user wants maximum block rate.
### The Customizable Scoring Framework
| Metric | Weight Range | Conservative | Yield-Focused | Decentralization |
|--------|--------------|--------------|---------------|------------------|
| Block Rate (50-epoch) | 20–40% | 35% | 20% | 25% |
| Lifetime Luck (50+ epochs) | 10–20% | 15% | 10% | 10% |
| Variable Margin | 15–25% | 15% | 30% | 15% |
| Fixed Fee Impact* | 10–20% | 20% | 15% | 15% |
| Saturation Buffer | 10–15% | 10% | 10% | 15% |
| Pledge Ratio | 5–15% | 5% | 5% | 20% |
| Operator Reliability | 10–20% | 20% | 10% | 10% |
*Fixed Fee Impact = (Fixed Fee / Your Stake) × (1 - Margin) — calculate for YOUR stake amount
### Scoring Each Dimension (0–100 Scale)
**Block Rate**: 98%+ = 100, 95% = 80, 90% = 50, <90% = 0
**Luck**: 95–105% = 100, 90–110% = 80, 85–115% = 60, <85% = 0
**Margin**: 0–1% = 100, 1–2% = 85, 2–3% = 70, 3–5% = 50, >5% = 0
**Saturation Buffer**: >50% = 100, 30–50% = 80, 10–30% = 50, <10% = 0
**Pledge Ratio**: >5% = 100, 2–5% = 80, 1–2% = 60, <1% = 30
### Example: Scoring Three Pools for a ₳5,000 Delegator
| Metric | Pool A (₳12M, 2%, ₳200K pledge) | Pool B (₳45M, 1.5%, ₳500K pledge) | Pool C (₳8M, 3%, ₳50K pledge) |
|--------|----------------------------------|-----------------------------------|-------------------------------|
| Block Rate (97%) | 90 | 95 | 85 |
| Luck (102%) | 100 | 100 | 90 |
| Margin (2%/1.5%/3%) | 70 | 85 | 50 |
| Fixed Fee Drag (₳340/₳5K) | 45 | 45 | 45 |
| Saturation Buffer (85%/30%/90%) | 50 | 80 | 100 |
| Pledge Ratio (1.7%/1.1%/0.6%) | 80 | 80 | 60 |
| Operator Reliability | 85 | 90 | 70 |
| **Conservative Weighted** | **78** | **82** | **68** |
| **Yield-Focused Weighted** | **72** | **85** | **62** |
Pool B wins for both profiles. Pool C's high margin and low pledge drag it down despite good saturation buffer.
> **Vietnam insight**: For ₳2K stakes, Fixed Fee Drag = (340/2000) × 0.98 = **16.7% effective margin**. A 2% variable margin pool effectively charges ~18.7%. At ₳10K, it's ~5.3%. Small delegators should weight fixed fee 2x higher.
---
## Operator Behavior Patterns: The Hidden Predictor
Historical metrics tell you *what happened*. Operator behavior tells you *what will happen*.
### The Operator Reliability Score (40/30/30)
**40% Operational Track Record**
- 50-epoch block rate trend (improving/stable/declining)
- Zero missed slots in last 12 epochs = +20
- Key rotation completed on time last 3 cycles = +15
- Relay count ≥3 with geographic diversity = +15
- Monitoring/alerting evidence (status page, Twitter updates) = +10
**30% Behavioral Signals**
- Fee changes: 0 changes in 12 months = +20, 1 change = +10, >1 = 0
- Pledge trajectory: Increasing = +20, Stable = +10, Decreasing = 0
- Communication: Weekly updates = +20, Monthly = +10, Silent >60 days = -20
- Infrastructure investment: New relays, hardware upgrades = +15
**30% Transparency & Accountability**
- Doxxed or reputable pseudo-anon identity = +20
- Public incident postmortems = +20
- Open-source tooling contributions (CNTools, guild scripts, APIs) = +15
- Community engagement (Telegram/Discord responsive) = +15
- Audit reports (SPOCRA, Guild) = +20
### Red Flags (Auto-Disqualify)
- ❌ Anonymous operator + no audit + silent >90 days
- ❌ Margin increased >2x in 6 months
- ❌ Pledge dropped to near-zero
- ❌ Key rotation failure in last 12 months
- ❌ Relay count dropped below 2
- ❌ Pool saturated + no sister pool announced
---
## Analyzing Stake Pool Data: Step-by-Step Workflow
Here's your repeatable **analyze stake pool data** process:
### Step 1: Define Your Delegator Profile (5 minutes)
- Stake amount: ₳____
- Priority: Conservative / Yield / Decentralization / Balanced
- Switching tolerance: Willing to move annually / quarterly / monthly
- Tax sensitivity: High (minimize taxable events) / Low
### Step 2: Initial Screen (10 minutes)
1. Export pool list from adapools.org or PoolTool.io (CSV)
2. Filter: Unsaturated (<90% saturation), Margin ≤5%, Block rate ≥90%
3. Result: 50–200 pools depending on filters
### Step 3: Peer Group Construction (10 minutes)
1. Identify 3–5 candidate pools
2. For each, build peer group (±20% stake, ±1% margin, same region)
3. Calculate peer group averages for block rate, luck, fees
### Step 4: Deep Dive on Top 3 (20 minutes per pool)
1. **50-epoch trend charts**: Block rate, luck, stake, fees
2. **Operator profile**: Fee history, pledge history, relay changes, communication
3. **Saturation buffer projection**: Months to saturation at current growth
4. **Fixed fee drag calculation** for YOUR stake amount
5. **Score using your weighted model**
### Step 5: Test Delegate (1 epoch = 5 days)
1. Delegate small amount (₳100–₳1000) to top choice
2. Verify rewards received match estimates
3. Confirm wallet UX, tax reporting compatibility
### Step 6: Full Delegation + Monitoring Setup
1. Delegate full amount
2. Set PoolTool webhook alerts for: missed slots, fee changes, saturation breach
3. Calendar reminder: Monthly 5-minute review (block rate, stake trend, fee check)
---
## Comparative Analysis: adapools.org vs PoolTool.io for Analysis
| Analysis Task | Best Tool | Why |
|---------------|-----------|-----|
| Peer group building | adapools.org | "Similar Pools" one-click, clean UI |
| Trend charts (12+ months) | PoolTool.io | Granular historical data, exportable |
| Block-by-block timeline | PoolTool.io | Slot-level detail, orphaned block visibility |
| Mobile quick-check | adapools.org | Native iOS/Android app, push alerts |
| Operator deep-dive | PoolTool.io | Relay monitoring, infrastructure detail |
| Custom scoring | Both → Export CSV → Spreadsheet | Neither has customizable weighting |
**Pro workflow**: Use adapools for screening → PoolTool for deep dive → Spreadsheet for scoring.
---
## Advanced: Multi-Pool Strategy with Analytical Rigor
For stakes >₳100K, single-pool delegation concentrates risk. But splitting randomly reduces analytical clarity.
### Analytical Multi-Pool Framework
1. **Define pool roles** (not just "split evenly"):
- **Core** (60%): Highest-scoring pool by your model
- **Hedge** (25%): Different operator, different geography, different relay provider
- **Satellite** (15%): Small pool (<₳10M) with high pledge, supporting decentralization
2. **Correlation check**: Ensure pools don't share:
- Same relay provider (AWS region, data center)
- Same operator (even pseudo-anon)
- Same jurisdiction (regulatory risk)
3. **Rebalancing rule**: Quarterly review. Rebalance if:
- Any pool's score drops >15 points
- Saturation buffer <20% on any pool
- New pool enters peer group scoring >10 points higher
---
## FAQ
### How do I compare two stake pools statistically?
Build a peer group for each, then compare each pool to its own peer group average (z-score). A pool at +1.5σ on block rate in its peer group is outperforming; at -1.5σ it's underperforming. Never compare raw metrics across different stake tiers.
### What time period is meaningful for pool analysis?
**Minimum 50 epochs (~250 days)** for luck and block rate confidence. For trend analysis, use the 3-window framework: 3-epoch (acute), 12-epoch (medium), 50-epoch (structural). Daily/weekly checks are noise.
### How to build a peer group for benchmarking?
Filter pools by: active stake ±20%, variable margin ±1%, geographic relay region. Tools: adapools.org "Similar Pools", PoolTool.io "Peer Comparison", or manual CSV filter. For stakes <₳5M, peer groups don't exist — use absolute thresholds instead.
### When is luck statistically significant vs noise?
At 1 epoch: never significant. At 12 epochs: weak signal (±20% CI). At 50 epochs: meaningful (±10% CI). At 100 epochs: strong (±7% CI). Require ≥50 epochs and luck <90% or >110% to flag.
### What tools automate pool performance analysis?
- **adapools.org**: Screening, peer groups, mobile alerts
- **PoolTool.io**: Deep historical analysis, operator infrastructure, webhooks
- **cardanoscan.io / cexplorer.io**: Alternative data views, API access
- **Custom**: Export CSV → Python/R spreadsheet for custom scoring models
### How does fixed fee affect small delegators disproportionately?
**Fixed Fee Drag = (Fixed Fee / Your Stake) × (1 - Margin)**. At ₳2K stake with ₳340 fee and 2% margin: 16.7% effective drag. At ₳100K: 0.33%. Small delegators should prioritize pools with ₳340 fixed fee (protocol minimum) and weight this 2x in scoring.
### Can I automate my monthly pool review?
Yes. PoolTool.io webhooks → Telegram/Discord/email for: missed slot events, fee change announcements, saturation threshold breach (set at 85%), stake growth acceleration. Calendar reminder for manual 5-minute scorecard review.
---
## Summary: Your Analysis Checklist
Before delegating, complete this analytical review:
- [ ] **Delegator profile defined** (stake amount, priority, switching tolerance)
- [ ] **Peer groups built** for 3–5 candidate pools (±20% stake, ±1% margin)
- [ ] **50-epoch trends reviewed** (block rate, luck, stake, fees) — no declining trajectories
- [ ] **Custom score calculated** with your weighted model
- [ ] **Fixed fee drag computed** for YOUR stake amount
- [ ] **Saturation buffer projected** (>3 months runway)
- [ ] **Operator reliability scored** (40/30/30 framework) — no red flags
- [ ] **Test delegation completed** (1 epoch, rewards verified)
- [ ] **Monitoring alerts configured** (missed slots, fee changes, saturation)
- [ ] **Calendar reminder set** (monthly 5-minute review)
---
*Pool performance analysis isn't a one-time task — it's a discipline. The data is public. The tools are free. The framework is repeatable. The only variable is whether you'll use it.*
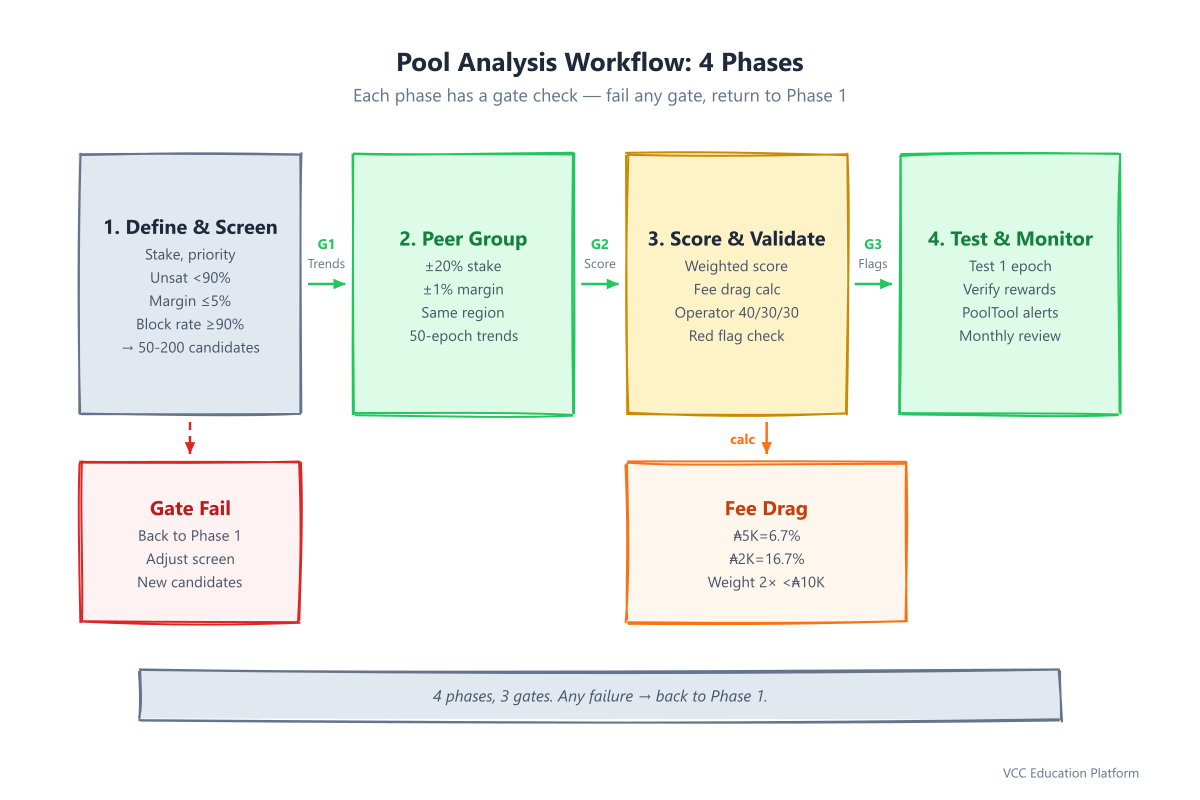
Figure 1: 4-phase workflow with 3 quality gates — any gate failure loops back to Phase 1
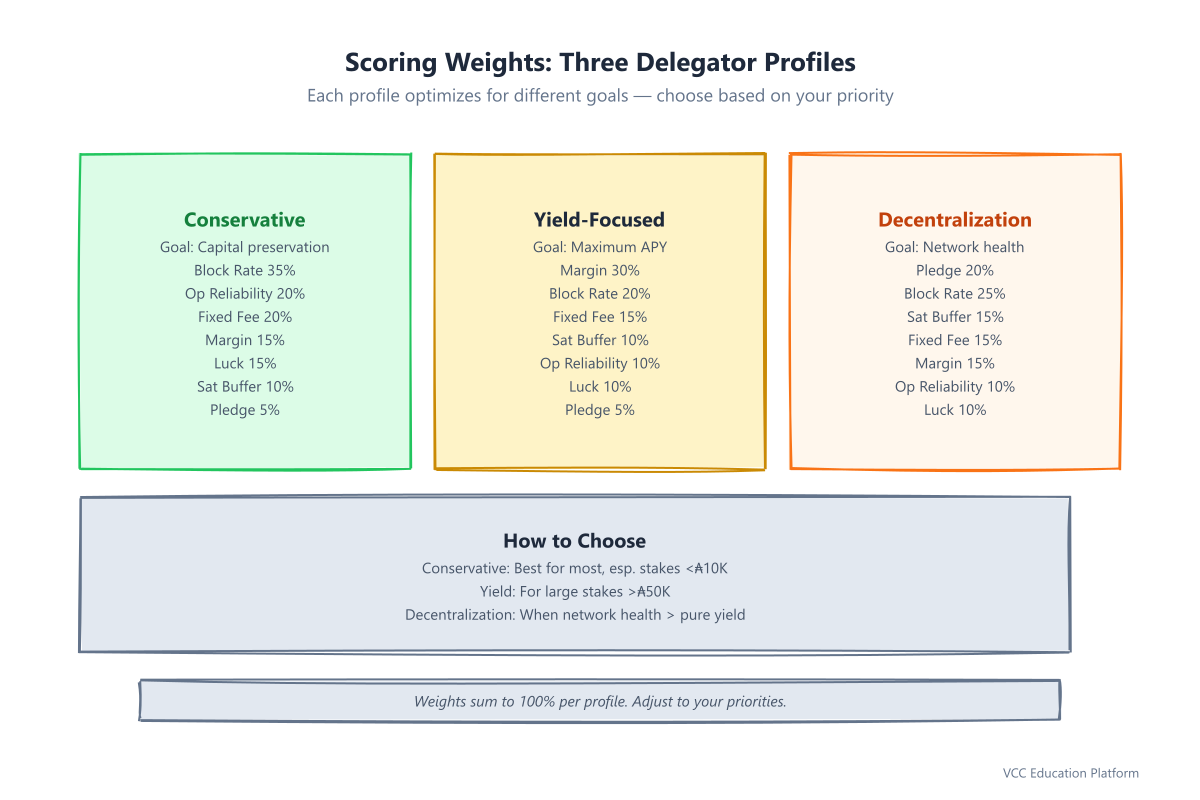
Figure 2: Three delegator profiles — Conservative prioritizes block rate & reliability; Yield prioritizes low margin; Decentralization prioritizes pledge & saturation buffer
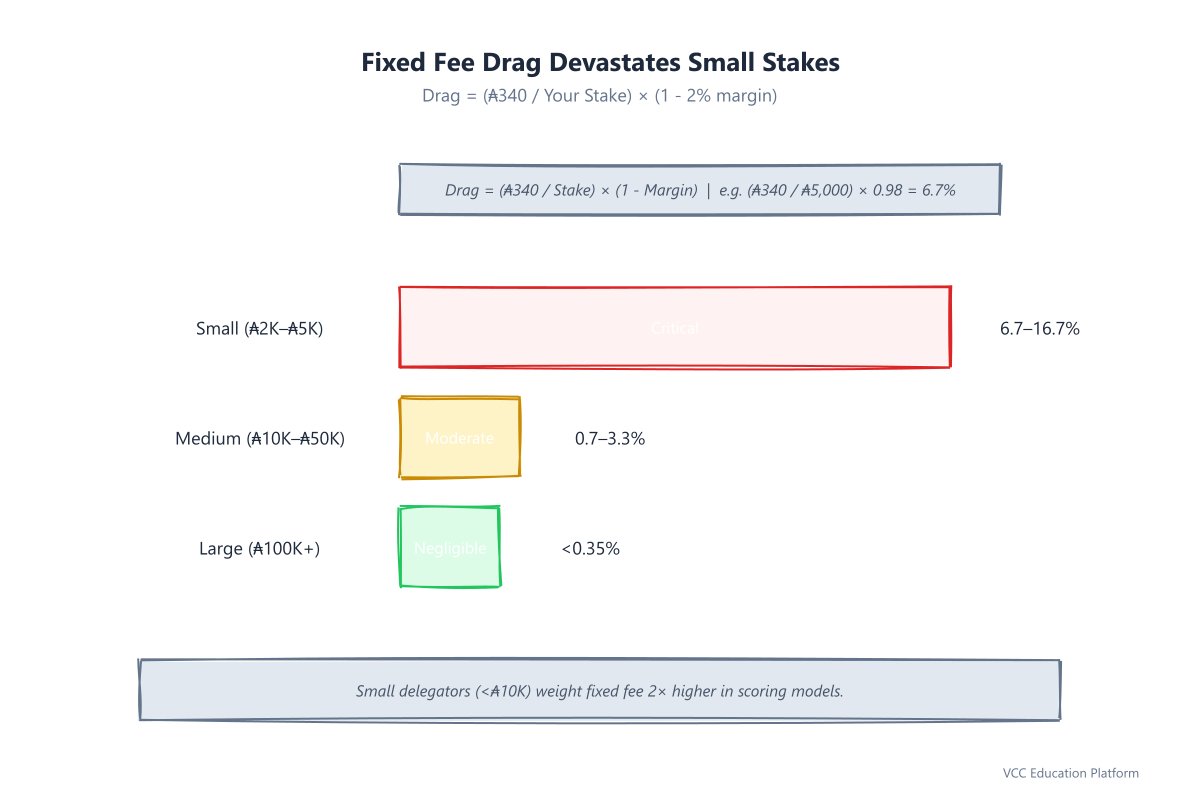
Figure 3: Fixed fee ₳340 inflicts 16.7% drag at ₳2K, 6.7% at ₳5K, only 0.33% at ₳100K — small delegators must weight fixed fee 2×
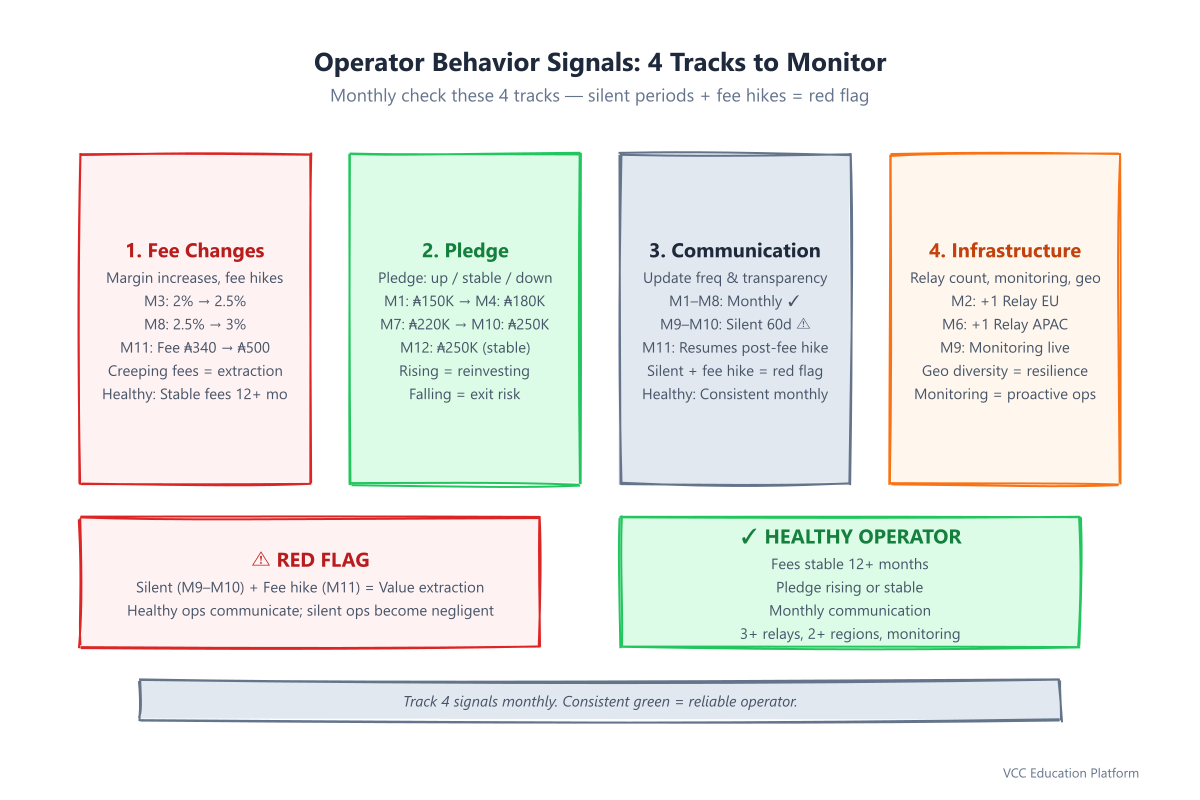
Figure 4: Four monthly signals — Silent period (M9–M10) + Fee hike (M11) = Red flag; Consistent green = reliable operator
