
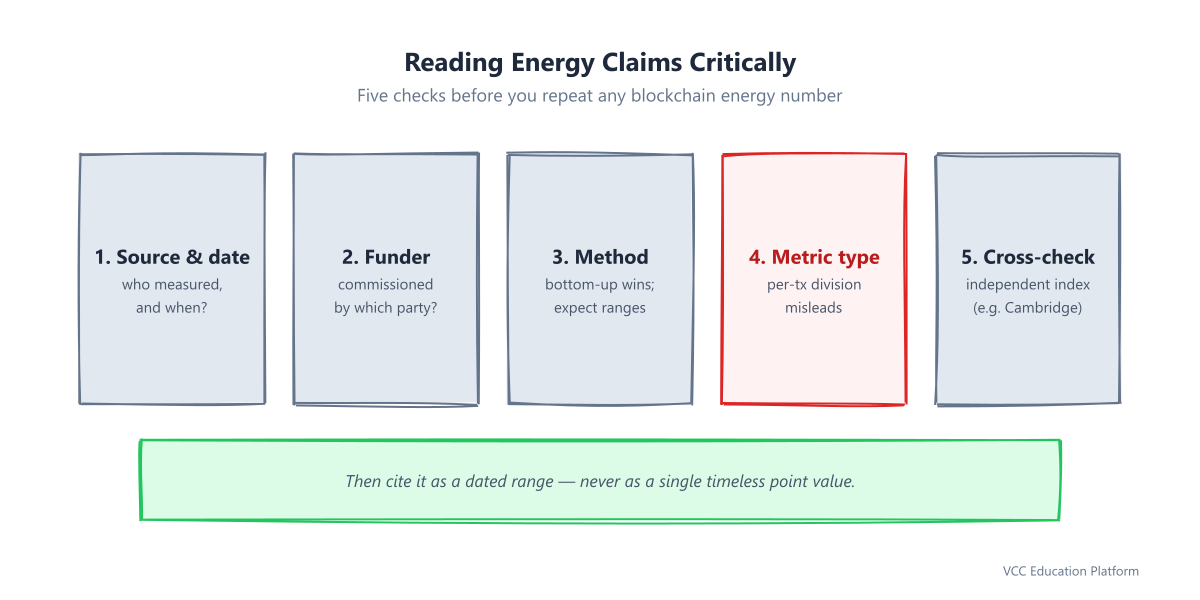
 Three context points make those numbers real:
- Global data centers consume about 190 TWh annually; gold mining about 131 TWh. Bitcoin belongs in that industrial tier.
- Netflix streaming uses roughly 0.46 TWh — more than all major proof-of-stake networks combined.
- Cardano's whole network runs at about 80 kW continuously. Picture 80 home air conditioners running simultaneously — that is the total electrical load securing every ADA transaction on Earth.
One nuance most articles skip: after Ethereum's Merge in September 2022 cut its consumption by over 99.95%, the old framing of "green Cardano versus dirty Ethereum" expired. Today cardano vs ethereum energy comparisons show both chains within one order of magnitude of each other, both roughly five orders of magnitude below Bitcoin. The dividing line is consensus class — PoW versus PoS — not which chain has better marketing.
## Proof of Stake Energy: Why the Mechanism Beats Any Hardware Upgrade
You cannot optimize Proof of Work into efficiency, because expenditure *is* its security model. If mining became cheap, attacks would become cheap too. This is why Bitcoin's energy use scales with price and hashrate competition rather than with transaction volume — the network spends nearly the same whether blocks are empty or full.
Ouroboros works differently. In each five-day epoch, stake is snapshotted, slot leaders are selected pseudo-randomly weighted by stake, and producing a block costs milliseconds of computation. Security rests on the assumption that no attacker controls a majority of staked ADA — an expensive financial position that also risks destroying its own value through slashing-style accountability and market panic.
The practical consequence shows up directly in cardano power consumption: a stake pool needs only a modest server plus relay nodes, drawing tens of watts. There is no arms race because there is nothing to race for — your chance of selection depends on stake, not on buying faster machines than your neighbor.
Three context points make those numbers real:
- Global data centers consume about 190 TWh annually; gold mining about 131 TWh. Bitcoin belongs in that industrial tier.
- Netflix streaming uses roughly 0.46 TWh — more than all major proof-of-stake networks combined.
- Cardano's whole network runs at about 80 kW continuously. Picture 80 home air conditioners running simultaneously — that is the total electrical load securing every ADA transaction on Earth.
One nuance most articles skip: after Ethereum's Merge in September 2022 cut its consumption by over 99.95%, the old framing of "green Cardano versus dirty Ethereum" expired. Today cardano vs ethereum energy comparisons show both chains within one order of magnitude of each other, both roughly five orders of magnitude below Bitcoin. The dividing line is consensus class — PoW versus PoS — not which chain has better marketing.
## Proof of Stake Energy: Why the Mechanism Beats Any Hardware Upgrade
You cannot optimize Proof of Work into efficiency, because expenditure *is* its security model. If mining became cheap, attacks would become cheap too. This is why Bitcoin's energy use scales with price and hashrate competition rather than with transaction volume — the network spends nearly the same whether blocks are empty or full.
Ouroboros works differently. In each five-day epoch, stake is snapshotted, slot leaders are selected pseudo-randomly weighted by stake, and producing a block costs milliseconds of computation. Security rests on the assumption that no attacker controls a majority of staked ADA — an expensive financial position that also risks destroying its own value through slashing-style accountability and market panic.
The practical consequence shows up directly in cardano power consumption: a stake pool needs only a modest server plus relay nodes, drawing tens of watts. There is no arms race because there is nothing to race for — your chance of selection depends on stake, not on buying faster machines than your neighbor.
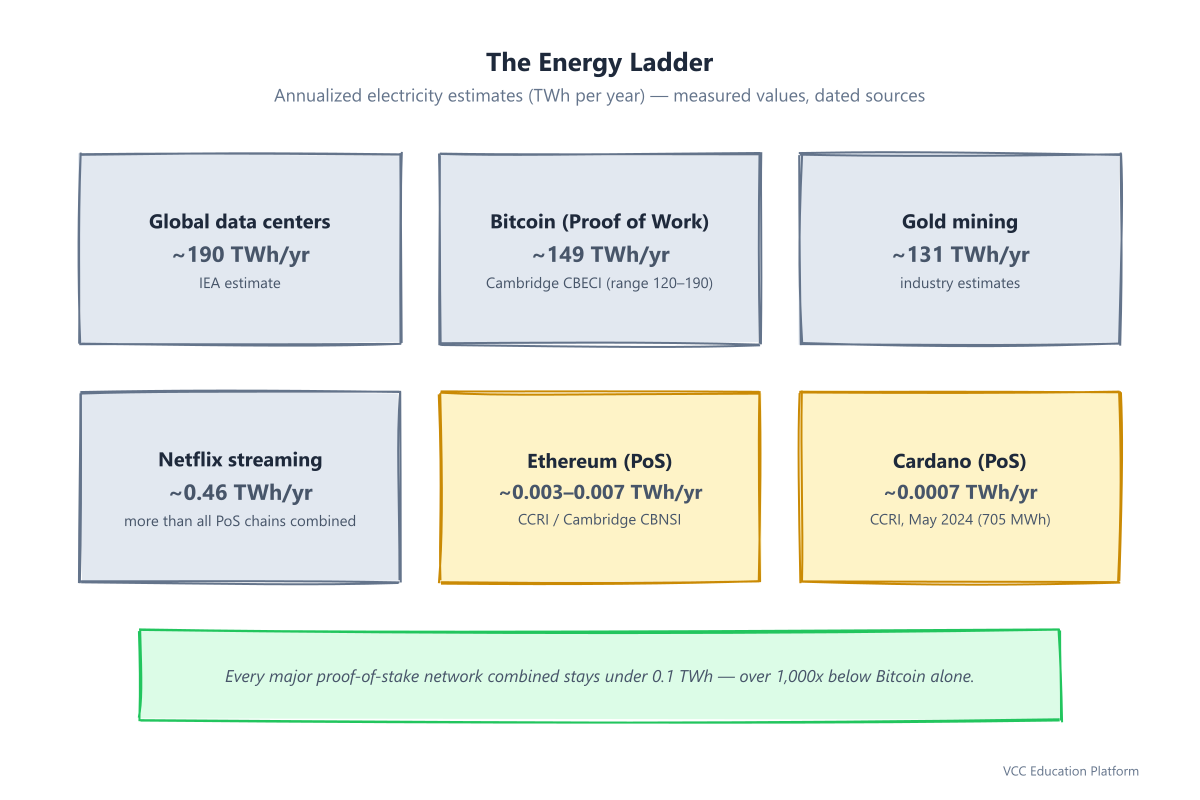 Ethereum reached the same destination in 2022 by replacing its miners with stakers; Cardano simply started there.
## What One Cardano Node Actually Consumes
Network totals involve aggregation assumptions, so the node-level measurement is the cleanest evidence. CCRI measured a representative Cardano node at 25.57 watts — comparable to a Wi-Fi router left running. Even accounting for the recommended setup (one block-producing node plus relays per pool), a full professional operation draws less than a single desktop gaming PC under load.
Scale check against daily life: average Vietnamese urban households consume roughly 150–200 kWh per month, so Cardano's entire planetary network (~705 MWh/year) equals the consumption of only a few hundred Vietnamese households. For readers who pay an EVN bill every month, that is the mental image worth keeping: not an invisible server farm the size of a district, but a distributed fleet of devices most of us already own equivalents of.
Ethereum reached the same destination in 2022 by replacing its miners with stakers; Cardano simply started there.
## What One Cardano Node Actually Consumes
Network totals involve aggregation assumptions, so the node-level measurement is the cleanest evidence. CCRI measured a representative Cardano node at 25.57 watts — comparable to a Wi-Fi router left running. Even accounting for the recommended setup (one block-producing node plus relays per pool), a full professional operation draws less than a single desktop gaming PC under load.
Scale check against daily life: average Vietnamese urban households consume roughly 150–200 kWh per month, so Cardano's entire planetary network (~705 MWh/year) equals the consumption of only a few hundred Vietnamese households. For readers who pay an EVN bill every month, that is the mental image worth keeping: not an invisible server farm the size of a district, but a distributed fleet of devices most of us already own equivalents of.
 ## How to Read Any Blockchain Energy Claim Critically
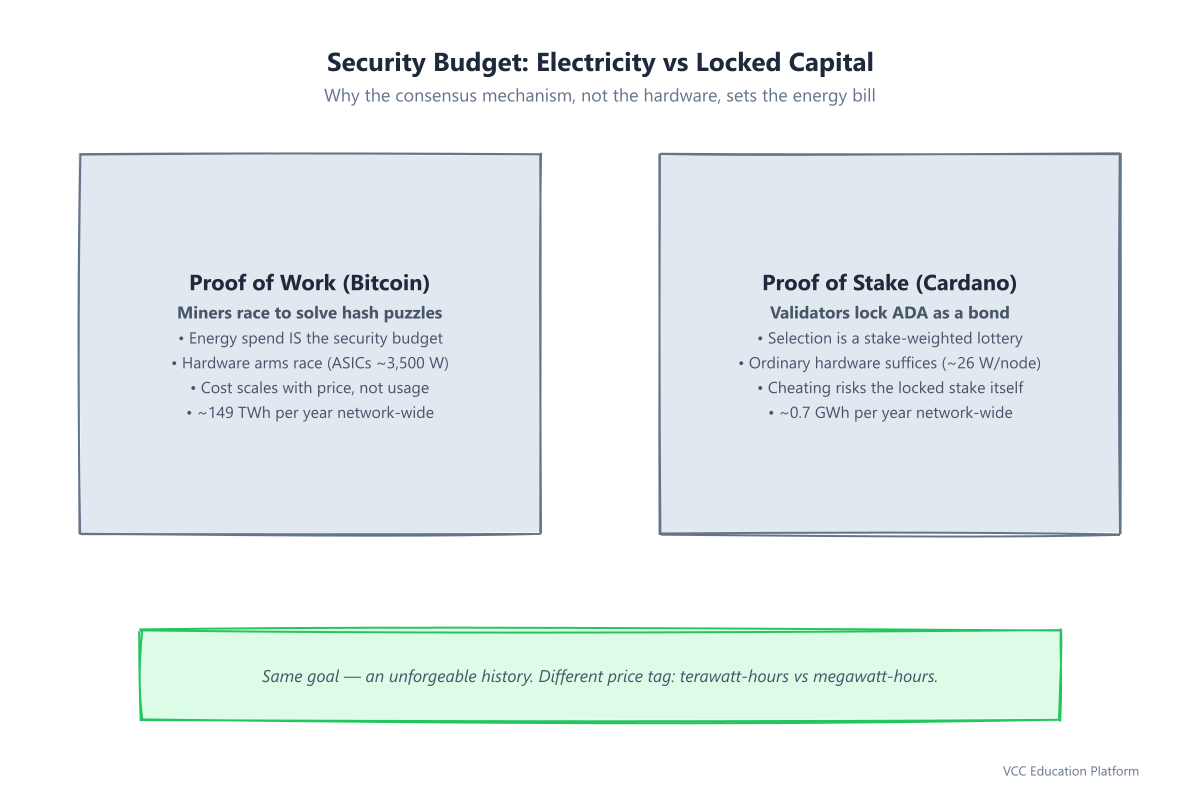
Energy figures are estimates, and the same network can carry three "correct" numbers at once. Before repeating any claim — including ours — run it through this checklist.
**First, ask who measured it and when.** CCRI's Cardano study was commissioned by the Cardano Foundation itself; it is methodologically transparent, but independent trackers like Cambridge exist precisely so no chain grades its own homework. Note also that pre-measurement community guesses varied wildly — estimates of "6 GWh" circulated before anyone instrumented actual nodes.
**Second, check the methodology class.** Bottom-up measurement beats top-down inference from price or hashrate. Even between reputable bottom-up sources, Ethereum's total ranges from 2.6 to 7+ GWh purely because of differing node-count and hardware assumptions — a spread you should expect, not distrust.
**Third, distrust per-transaction division.** Block production costs the same whether a block holds 5 transactions or 500, so dividing network energy by transaction count implies a variable cost that does not exist. This is why published figures for Cardano range from ~0.55 kWh down to 0.00012 kWh per transaction depending on definition — all defensible-looking, none meaning quite what headlines suggest.
## How to Read Any Blockchain Energy Claim Critically
Energy figures are estimates, and the same network can carry three "correct" numbers at once. Before repeating any claim — including ours — run it through this checklist.
**First, ask who measured it and when.** CCRI's Cardano study was commissioned by the Cardano Foundation itself; it is methodologically transparent, but independent trackers like Cambridge exist precisely so no chain grades its own homework. Note also that pre-measurement community guesses varied wildly — estimates of "6 GWh" circulated before anyone instrumented actual nodes.
**Second, check the methodology class.** Bottom-up measurement beats top-down inference from price or hashrate. Even between reputable bottom-up sources, Ethereum's total ranges from 2.6 to 7+ GWh purely because of differing node-count and hardware assumptions — a spread you should expect, not distrust.
**Third, distrust per-transaction division.** Block production costs the same whether a block holds 5 transactions or 500, so dividing network energy by transaction count implies a variable cost that does not exist. This is why published figures for Cardano range from ~0.55 kWh down to 0.00012 kWh per transaction depending on definition — all defensible-looking, none meaning quite what headlines suggest.
 The mature conclusion is not that PoS chains are virtuous, but that they are categorically cheaper to secure. A fair reading acknowledges Bitcoin's counterargument too — miners argue their energy purchases subsidize renewable build-out and monetize stranded generation. Efficiency and environmental virtue overlap, but they are not identical claims.
## Frequently Asked Questions
### Does Cardano really use less energy than Bitcoin?
Yes, by roughly five orders of magnitude. CCRI measured Cardano at ~704.91 MWh per year versus Cambridge's ~149 TWh estimate for Bitcoin — a gap of about 200,000×. The difference is structural: Bitcoin buys security with electricity, Cardano buys it with staked collateral.
### Is Cardano more energy-efficient than Ethereum after the Merge?
On absolute network consumption, yes modestly — Cardano's ~0.7 GWh sits below Ethereum's estimated 2.6–7.3 GWh. On a per-transaction basis Ethereum often looks better because it processes far more transactions over similar infrastructure. Both are within one order of magnitude of each other and vastly more efficient than any remaining Proof of Work chain.
### Why does proof of stake use so little energy?
Because agreement no longer requires computation. In PoW, expending electricity is the barrier that makes rewriting history unaffordable. In PoS, the barrier is locked capital — an attacker must acquire and risk a large stake instead of out-computing the world. Selecting block producers becomes a lightweight lottery, runnable on consumer hardware.
### What is the cardano power consumption of a single transaction?
There is no single honest answer, and that is the point. Marginal cost per additional transaction approaches zero (CCRI models it at just 0.192 W per unit of throughput); simple division yields ~0.55 kWh; MiCA-standard disclosures report 0.00012 kWh. Since block energy is independent of how many transactions a block contains, treat per-transaction numbers as rough comparison tools, never as literal bills.
## Conclusion
Cardano's energy efficiency is real and measurable: a globally secured network running on megawatt-hours, nodes sipping router-class power, and a footprint hundreds of thousands times smaller than Bitcoin's. But the deeper lesson of this comparison is methodological — the numbers you cite are only as good as the measurement behind them. When evaluating any blockchain's environmental claims, check the source, date, commissioning party, and metric definition first. For Vietnamese holders deciding where to delegate their ADA, energy efficiency now joins security and decentralization as a dimension where proof-of-stake design lets you support a greener network without sacrificing either.
*Figures cited: CCRI Cardano Network Assessment (July 2024); ethereum.org energy-consumption page citing CCRI (2022); Cambridge CBECI/CBNSI. All values are point-in-time estimates and shift with node counts and grid mixes.*
The mature conclusion is not that PoS chains are virtuous, but that they are categorically cheaper to secure. A fair reading acknowledges Bitcoin's counterargument too — miners argue their energy purchases subsidize renewable build-out and monetize stranded generation. Efficiency and environmental virtue overlap, but they are not identical claims.
## Frequently Asked Questions
### Does Cardano really use less energy than Bitcoin?
Yes, by roughly five orders of magnitude. CCRI measured Cardano at ~704.91 MWh per year versus Cambridge's ~149 TWh estimate for Bitcoin — a gap of about 200,000×. The difference is structural: Bitcoin buys security with electricity, Cardano buys it with staked collateral.
### Is Cardano more energy-efficient than Ethereum after the Merge?
On absolute network consumption, yes modestly — Cardano's ~0.7 GWh sits below Ethereum's estimated 2.6–7.3 GWh. On a per-transaction basis Ethereum often looks better because it processes far more transactions over similar infrastructure. Both are within one order of magnitude of each other and vastly more efficient than any remaining Proof of Work chain.
### Why does proof of stake use so little energy?
Because agreement no longer requires computation. In PoW, expending electricity is the barrier that makes rewriting history unaffordable. In PoS, the barrier is locked capital — an attacker must acquire and risk a large stake instead of out-computing the world. Selecting block producers becomes a lightweight lottery, runnable on consumer hardware.
### What is the cardano power consumption of a single transaction?
There is no single honest answer, and that is the point. Marginal cost per additional transaction approaches zero (CCRI models it at just 0.192 W per unit of throughput); simple division yields ~0.55 kWh; MiCA-standard disclosures report 0.00012 kWh. Since block energy is independent of how many transactions a block contains, treat per-transaction numbers as rough comparison tools, never as literal bills.
## Conclusion
Cardano's energy efficiency is real and measurable: a globally secured network running on megawatt-hours, nodes sipping router-class power, and a footprint hundreds of thousands times smaller than Bitcoin's. But the deeper lesson of this comparison is methodological — the numbers you cite are only as good as the measurement behind them. When evaluating any blockchain's environmental claims, check the source, date, commissioning party, and metric definition first. For Vietnamese holders deciding where to delegate their ADA, energy efficiency now joins security and decentralization as a dimension where proof-of-stake design lets you support a greener network without sacrificing either.
*Figures cited: CCRI Cardano Network Assessment (July 2024); ethereum.org energy-consumption page citing CCRI (2022); Cambridge CBECI/CBNSI. All values are point-in-time estimates and shift with node counts and grid mixes.*