
RWA analytics has become essential for anyone navigating the rapidly growing real-world asset tokenization market. With over $13 billion in tokenized assets across dozens of chains and hundreds of issuers, the challenge isn't finding data—it's knowing which platform answers which question.
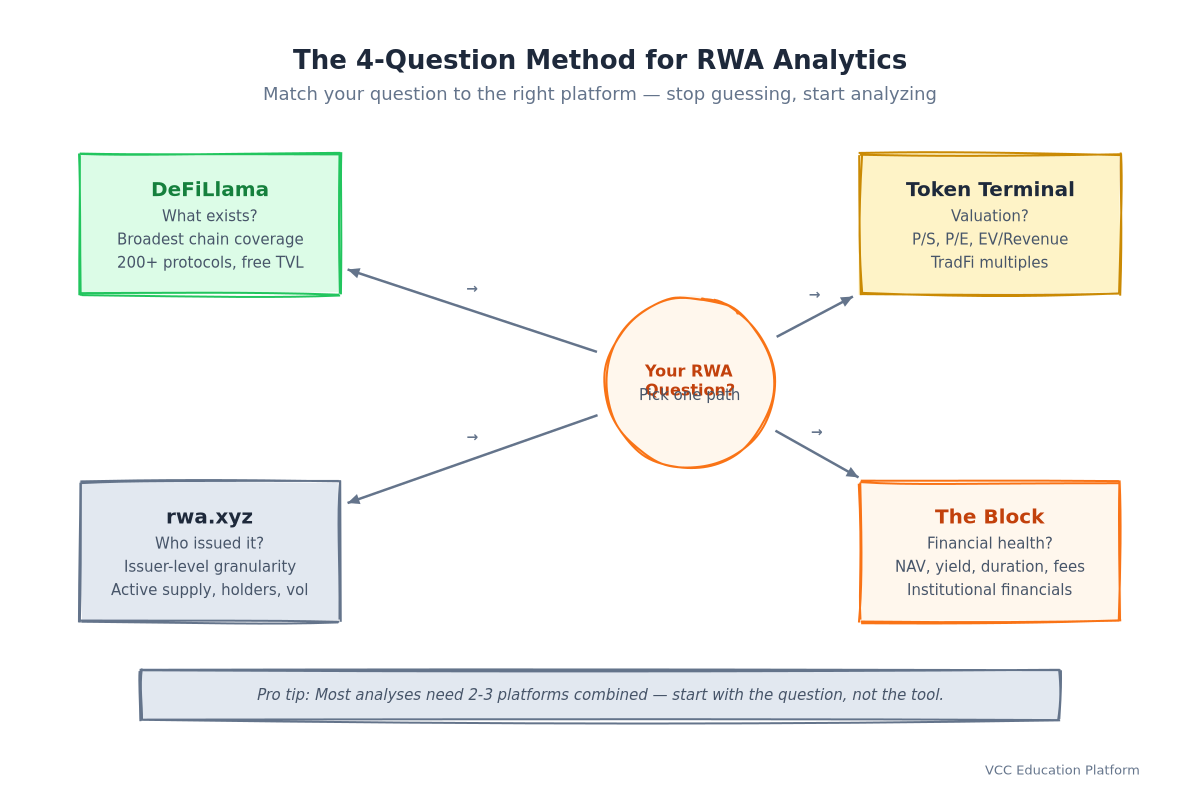
Imagine walking into a library where every book is written in a different language, shelved by a different system, and some books only show you the cover while others let you read every page. That's the RWA data landscape today. Four platforms dominate: rwa.xyz, The Block, Token Terminal, and DeFiLlama. Each excels at something different. This guide teaches you the "4-Question Method" to navigate them like a pro.
Why RWA Analytics Is Different from DeFi Analytics
Traditional DeFi analytics (TVL, volume, fees) work because protocols are fully on-chain. RWAs break this model. A tokenized Treasury bill has:
- On-chain component: The token (ERC-20, SPL, etc.) tracking ownership
- Off-chain component: The actual T-bill custodied at BNY Mellon or State Street
- Legal component: SPV structure, bankruptcy remoteness, regulatory status
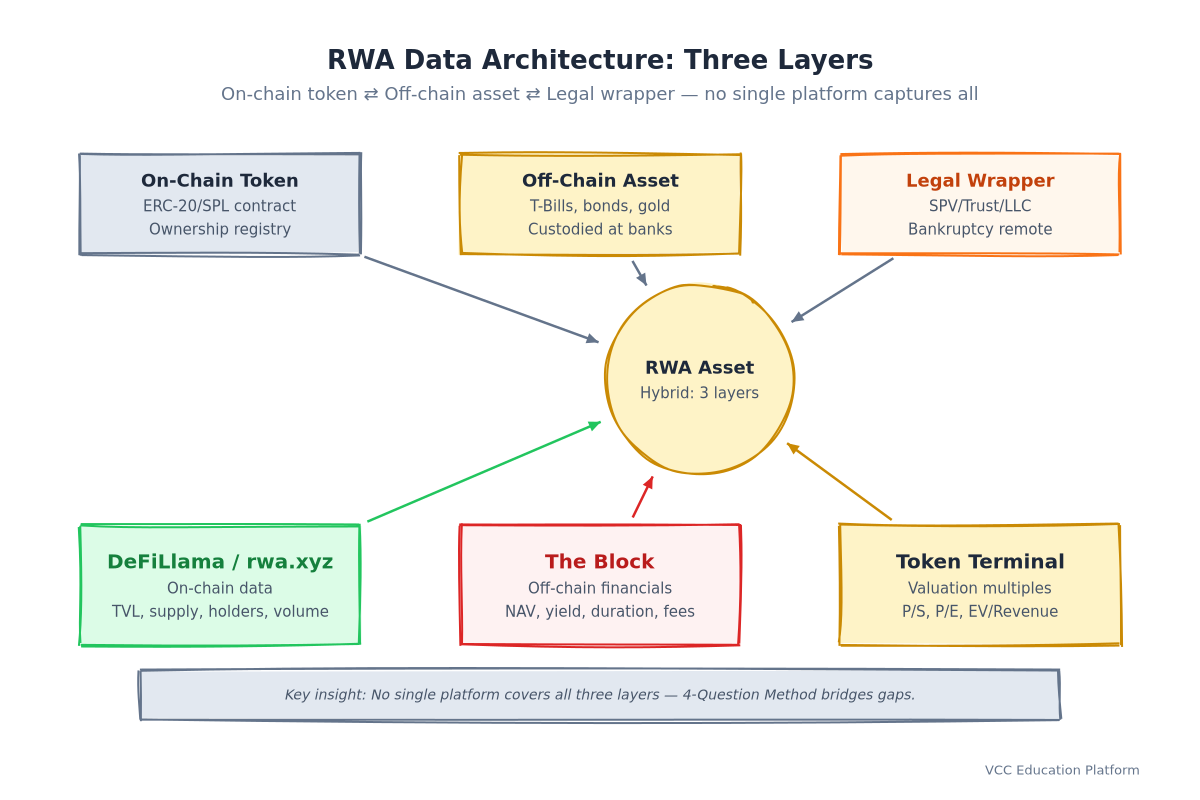
This hybrid nature means no single platform captures everything. rwa.xyz bridges on-chain tokens to off-chain issuers. The Block adds institutional financials (NAV, yield, duration). Token Terminal applies TradFi valuation multiples. DeFiLlama provides the broadest chain-level TVL view.
Primary keyword placement: RWA analytics appears in H1, first 100 words, and throughout.
The 4-Question Method: Match Your Question to the Right Tool
Before opening any dashboard, ask: What am I actually trying to answer?
| Question | Best Platform | Why |
|---|---|---|
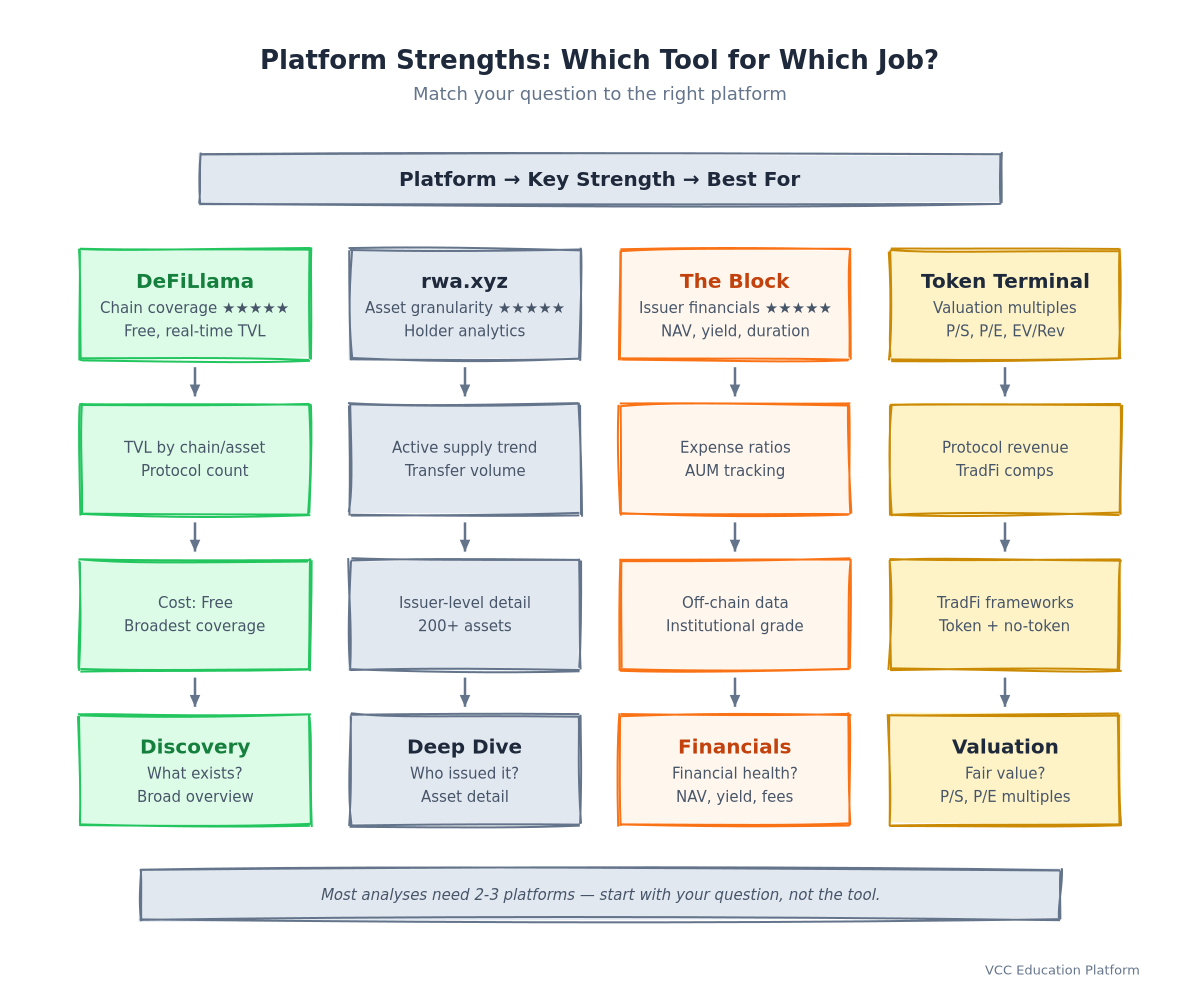
| "What RWA assets exist on which chains?" | DeFiLlama | Broadest coverage (200+ protocols, 30+ chains) |
| "Who issued this asset, and what's the active supply?" | rwa.xyz | Issuer-level granularity, holder analytics, transfer volume |
| "What's the NAV, yield, and expense ratio?" | The Block | Institutional financials from off-chain sources |
| "Is this protocol over/undervalued vs peers?" | Token Terminal | P/S, P/E, EV/Revenue multiples standardized |
Question 1: "What Exists?" → DeFiLlama
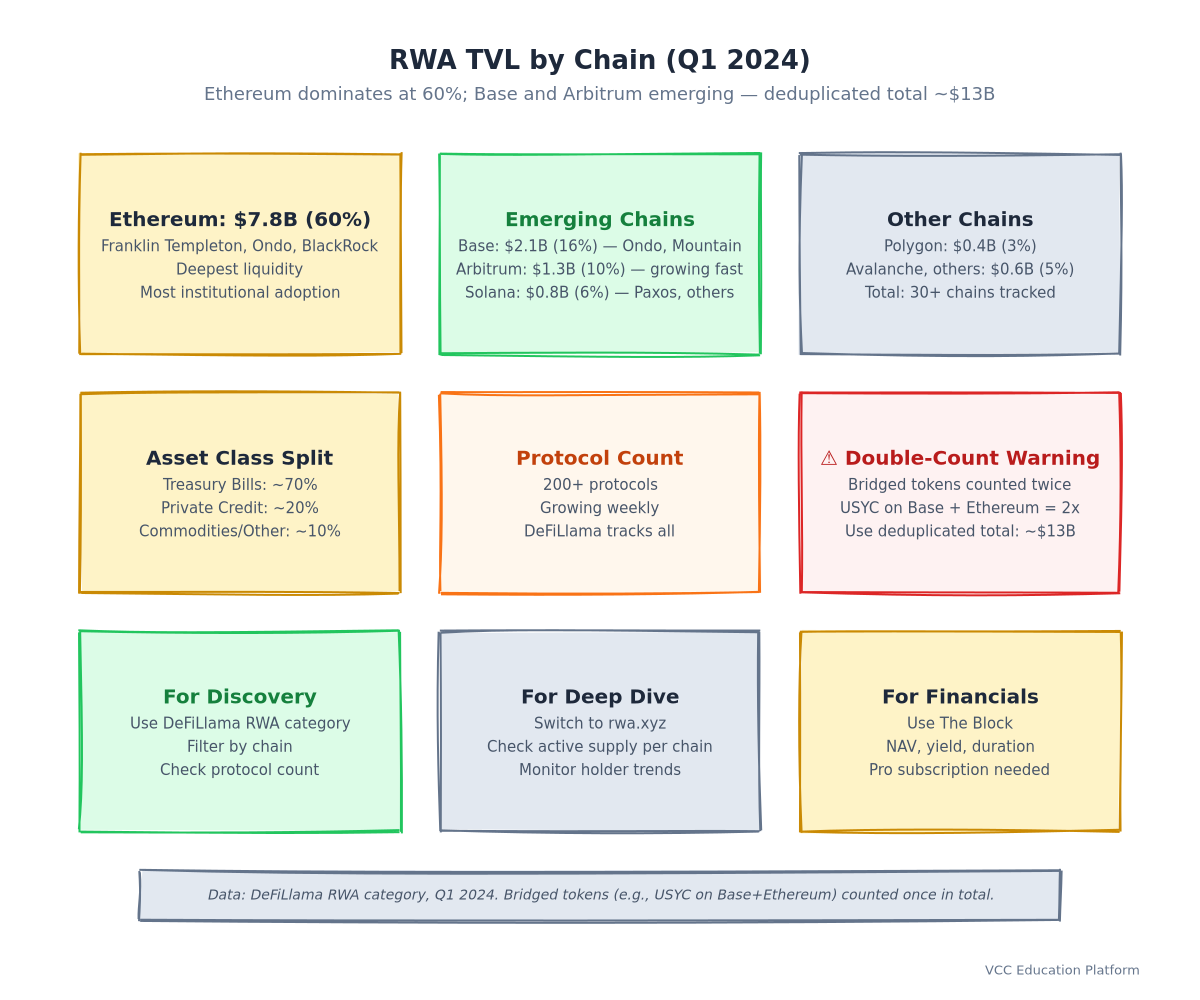
DeFiLlama's RWA category (defillama.com/category/rwa) is the discovery engine. It aggregates TVL across 30+ chains—Ethereum, Solana, Arbitrum, Base, Polygon, Avalanche, and more.
Key metrics to watch:
- TVL by chain: Ethereum ~60%, Base ~15%, Arbitrum ~10% (Q1 2024)
- TVL by asset class: Treasuries ~70%, Credit ~20%, Commodities/Other ~10%
- Protocol count: 200+ and growing weekly
Pro tip: Use the "Chains" breakdown to spot emerging ecosystems. Base's RWA TVL grew 4x in Q1 2024—largely driven by Ondo Finance and Mountain Protocol expansions.
Warning: DeFiLlama TVL includes bridged assets. A USYC token on Base bridged from Ethereum counts twice if you sum chain TVLs. Always check the "Total" (deduplicated) figure.
Question 2: "Who Issued It?" → rwa.xyz
rwa.xyz is the only platform built exclusively for RWA asset-level analytics. It tracks 200+ individual tokenized assets with issuer attribution.
What makes it unique:
- Issuer profiles: Franklin Templeton (BENJI), Ondo Finance (OUSG, USDY), Mountain Protocol (USDM), BlackRock (BUIDL), and 50+ others
- Active supply vs. total minted: Critical distinction. BENJI shows $400M active supply but $600M minted—the difference is redemptions in flight
- Holder concentration: Top 10 holders %, retail vs. institutional split
- Transfer volume: Daily/weekly/monthly—liquidity proxy for illiquid assets
- Chain deployment: Which chains each asset lives on
Navigating the dashboard:
- Asset Explorer → Filter by asset class (Treasury, Credit, Commodity, Equity)
- Issuer Page → Deep dive: active supply trend, holder count, transfer volume, chain distribution
- Compare Tool → Side-by-side: OUSG vs USDY vs BENJI on yield, supply, holders
Real example: Comparing OUSG (Ondo Short-Term US Treasury) vs USDY (Ondo Yield):
- OUSG: $200M active supply, 4.8% yield, 1,200 holders, Ethereum + Base
- USDY: $350M active supply, 5.2% yield, 800 holders, Ethereum + Solana + Mantle
- Insight: USDY has higher yield but fewer holders—more concentrated, potentially less liquid
Vietnamese context: Vietnamese investors tracking tokenized T-bills should monitor active supply trends on rwa.xyz. A declining active supply with stable minted supply = redemptions > subscriptions = potential yield compression ahead.
Question 3: "Financial Health?" → The Block
The Block Pro's RWA dashboard adds the TradFi layer: NAV (Net Asset Value), gross yield, net yield, duration, expense ratio, AUM. These come from issuer reports, not smart contracts.
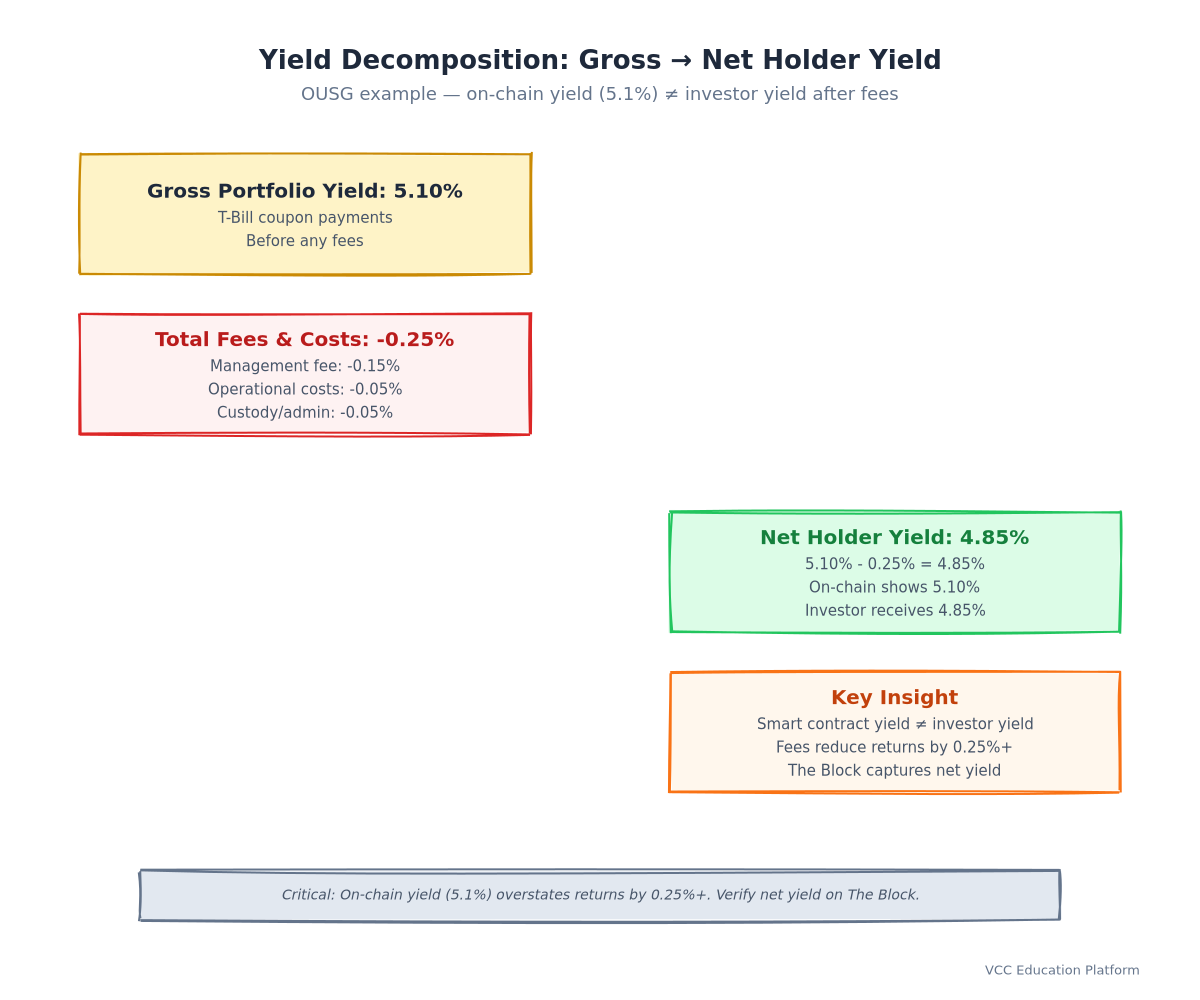
Why this matters: On-chain yield ≠ investor yield. OUSG's smart contract shows 5.1% but after Ondo's 0.15% fee and operational costs, net to holder is ~4.8%. The Block captures this.
Key dashboards:
- Issuer Financials: Revenue, expenses, profit margins for Ondo, Mountain, OpenEden, etc.
- Asset-Level NAV Tracking: Daily NAV per share vs. market price (premium/discount)
- Yield Decomposition: Gross portfolio yield → fees → net holder yield
Limitation: Data lags 1-3 weeks behind on-chain. New issuances (e.g., a new Franklin Templeton fund) appear on rwa.xyz day 1, on The Block week 3.
Question 4: "Valuation?" → Token Terminal
Token Terminal applies public company valuation frameworks to RWA protocols. Think P/S (Price-to-Sales), P/E (Price-to-Earnings), EV/Revenue—but for protocols.
How it works for RWAs:
- Revenue = Management fees collected on-chain (e.g., Ondo's 0.15% on OUSG/USDY)
- P/S = Market cap (governance token) / Annualized protocol revenue
- P/E = Market cap / Net income (revenue - token incentives - operating costs)
Example (Q1 2024):
| Protocol | Token | Market Cap | Annualized Revenue | P/S |
|---|---|---|---|---|
| Ondo Finance | ONDO | $800M | $12M | 67x |
| Mountain Protocol | (no token) | N/A | $3M | N/A |
| Franklin Templeton | (no token) | N/A | $2M | N/A |
Critical caveat: Most RWA issuers don't have tokens (Franklin, BlackRock, Mountain). Token Terminal only values protocols with tokens (Ondo, Maple, Goldfinch, Centrifuge). For tokenless issuers, you need The Block's financials + manual comps.
Deep Dive: Reading rwa.xyz Like an Analyst
Since rwa.xyz is the most RWA-specific tool, let's master its three most powerful views.
1. Market Cap by Asset Class / Chain / Issuer
The "Market Overview" page breaks down the $13B+ market three ways:
By Asset Class:
- Treasury Bills: ~$9B (70%)
- Private Credit: ~$2.5B (19%)
- Commodities (Gold, Oil): ~$1B (8%)
- Equities/Other: ~$500M (3%)
By Chain:
- Ethereum: $7.8B
- Base: $2.1B
- Arbitrum: $1.3B
- Solana: $800M
- Polygon: $400M
- Others: $600M
By Issuer (Top 5):
- Franklin Templeton (BENJI): ~$400M
- Ondo Finance (OUSG + USDY): ~$550M
- Mountain Protocol (USDM): ~$150M
- BlackRock (BUIDL): ~$500M
- OpenEden (TBILL): ~$100M
Analyst workflow: Start with the treemap → click an issuer → check "Active Supply Trend" (6M) → check "Holder Count" → check "Transfer Volume 30D". If all three are up, that's bullish adoption.
2. Holder Analytics: Concentration Risk
rwa.xyz shows holder count, top 10 holder %, and holder distribution buckets (1-10, 10-100, 100-1K, 1K-10K, 10K+ tokens).
Red flags:
- Top 10 holders > 80% = whale-dominated, exit risk
- Holder count declining while supply grows = concentration increasing
- Single holder > 25% = potential single point of failure
Green flags:
- Holder count growing faster than supply = broadening base
- Top 10% < 50% = healthy distribution
- 1K+ holder bucket growing = retail/institutional adoption
Vietnamese investor note: Local funds often appear as single large holders on-chain (omnibus wallets). Don't panic at high concentration—check if the holder is a known custodian (Fireblocks, Copper, local VASP).
3. Transfer Volume: The Liquidity Proxy
For RWAs without order books (most tokenized Treasuries), transfer volume is your best liquidity signal.
How to read it:
- Consistent daily volume ($1-5M/day for $200M asset) = healthy secondary activity
- Sporadic spikes = large redemptions/subscriptions, not trading
- Near-zero volume = illiquid, expect wide spreads if you need to exit
Advanced: Compare transfer volume / active supply ratio.
- Ratio > 5% monthly = liquid
- Ratio 1-5% = semi-liquid
- Ratio < 1% = illiquid (common for real estate, private credit tokens)
Cross-Platform Workflow: A Real Investigation
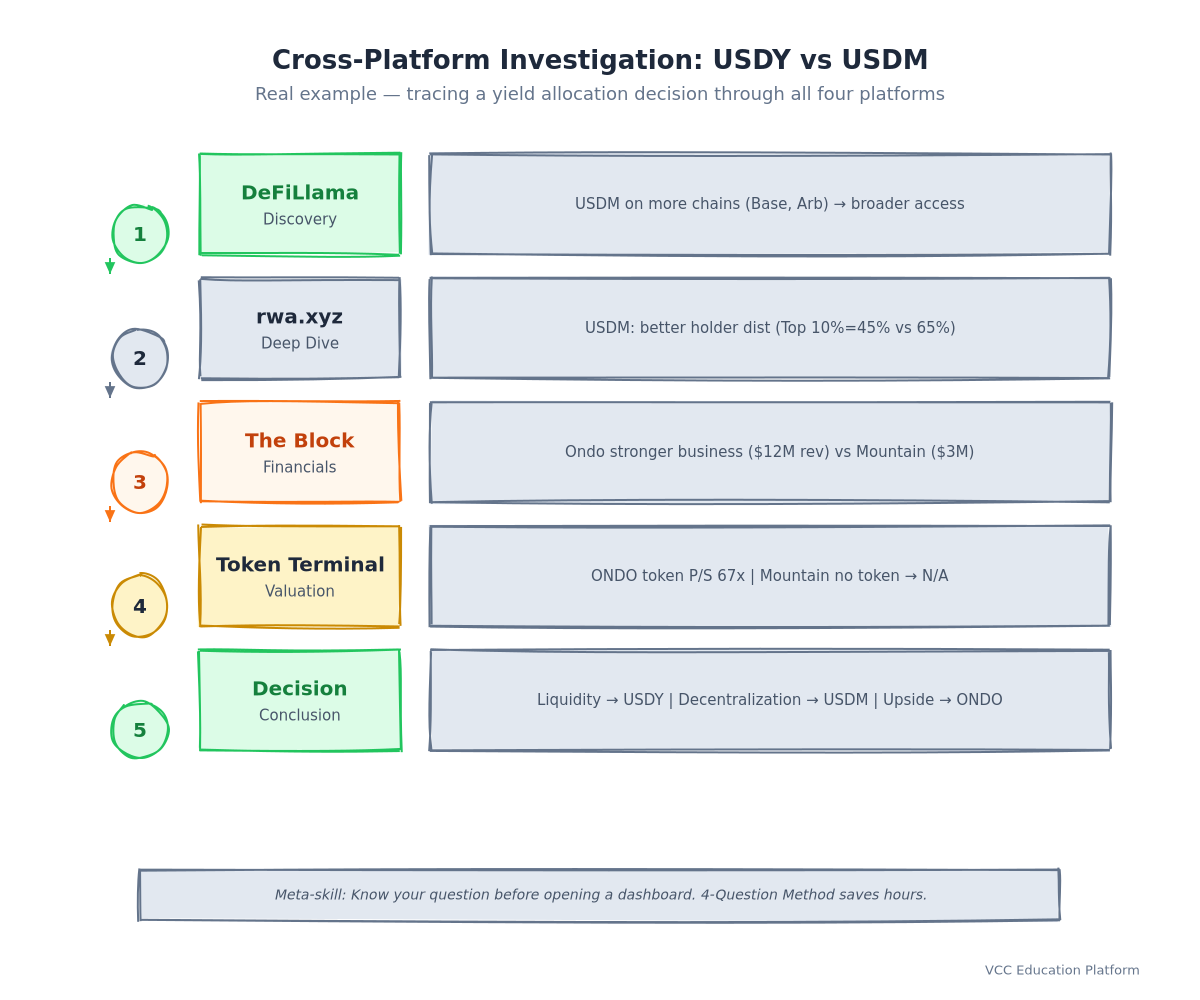
Let's trace a real question: "Should I allocate to USDY (Ondo Yield) or USDM (Mountain Protocol)?"
Step 1: DeFiLlama → Discovery
- Both appear in RWA category
- USDY: Ethereum, Solana, Mantle
- USDM: Ethereum, Solana, Base, Arbitrum
- USDM on more chains = broader access
Step 2: rwa.xyz → Asset Deep Dive
- USDY: $350M active supply, 5.2% yield, 800 holders, Top 10% = 65%
- USDM: $150M active supply, 5.0% yield, 1,200 holders, Top 10% = 45%
- Insight: USDM has better holder distribution (less concentrated)
Step 3: The Block → Financials
- Ondo (USDY issuer): $12M annualized revenue, 0.15% fee, profitable
- Mountain (USDM issuer): $3M revenue, 0.05% fee, breakeven
- Insight: Ondo has stronger business model; Mountain passes more yield to holders
Step 4: Token Terminal → Valuation
- ONDO token: P/S 67x (high, priced for growth)
- Mountain: No token → can't value directly
- Insight: Buying ONDO token ≠ buying USDY yield. Different risk/return.
Conclusion: For pure yield + liquidity → USDY. For yield + decentralization + lower fees → USDM. For protocol upside → ONDO token (separate decision).
Advanced: Building Your Own RWA Dashboard
If you need custom views, all four platforms offer data access:
| Platform | Access Method | Best For |
|---|---|---|
| rwa.xyz | API (paid), CSV export | Asset-level time series, holder analytics |
| The Block | Pro terminal, API (enterprise) | Institutional financials, NAV history |
| Token Terminal | SQL (Dune), API, CSV | Custom valuation models, protocol comps |
| DeFiLlama | API (free), SQL (Dune), CSV | Chain TVL, protocol metadata, historical |
Dune Analytics is the secret weapon: community-built dashboards often combine all four sources. Search "RWA" on Dune → fork a dashboard → customize.
Example Dune query (rwa.xyz + DeFiLlama): `sql -- Combine rwa.xyz active supply with DeFiLlama chain TVL WITH rwa_supply AS ( SELECT asset, chain, active_supply, date FROM rwa_xyz.active_supply_daily ), defillama_tvl AS ( SELECT chain, tvl, date FROM defillama.chain_tvl WHERE category = 'rwa' ) SELECT r.asset, r.chain, r.active_supply, d.tvl as chain_tvl FROM rwa_supply r JOIN defillama_tvl d ON r.chain = d.chain AND r.date = d.date WHERE r.date = CURRENT_DATE - 1 `
Common Pitfalls & How to Avoid Them
Pitfall 1: Confusing TVL with Active Supply
- DeFiLlama TVL = All value locked in contracts (includes bridged, unissued, staked)
- rwa.xyz Active Supply = Tokens actually held by investors (minted - burned - in-flight)
- Rule: Use active supply for adoption metrics; TVL for chain capacity.
Pitfall 2: Ignoring Transfer Volume on Illiquid Assets
A real estate token with $10M supply and $50K monthly volume isn't "liquid"—it's a locked position. Always check volume/supply ratio.Pitfall 3: Double-Counting Bridged Assets
Summing chain TVLs on DeFiLlama double-counts bridged tokens. Use the deduplicated "Total TVL" figure.Pitfall 4: Applying Token Terminal P/E to Non-Token Issuers
Franklin Templeton, BlackRock, Mountain Protocol have no tokens. Token Terminal shows "N/A"—don't force a valuation. Use The Block's financials + public comps.Pitfall 5: Chasing Yield Without Checking Duration
A 5.5% yield on 2-year duration ≠ 5.5% on 3-month duration. The Block shows duration; rwa.xyz shows asset class. Match duration to your liability horizon.Vietnamese Market Application
For Vietnam-based investors and builders:
Local Access Points:
- Remitano / Bvnex: Listing tokenized Treasury products (OUSG, USDY via partners)
- VNDC: Exploring RWA yield vaults for VND stablecoin holders
- Local VASPs: Fireblocks Vietnam, Copper Vietnam custody for institutional RWA access
Regulatory Watch:
- Circular 19/2023/TT-NHNN: Digital asset framework—RWA classification pending
- State Bank of Vietnam: Sandbox for tokenized bonds (2024 pilot)
- Tax: Circular 96/2015/TT-BTC - capital gains on tokenized assets unclear
Practical Workflow for VN Investor:
- DeFiLlama → Check which RWA assets are on chains you can access (Ethereum, Base, Solana)
- rwa.xyz → Verify active supply, holder count, transfer volume for your shortlist
- The Block (if Pro) → Confirm net yield after fees, check duration
- Local exchange → Check availability, VND on-ramp fees, custody model
FAQ
Q: Which platform is best for a beginner? A: Start with DeFiLlama (free, broad overview), then graduate to rwa.xyz for asset-level detail.
Q: Do I need paid subscriptions? A: DeFiLlama = free. rwa.xyz = free tier covers 90% of needs. The Block Pro = $399/yr (worth it for institutional financials). Token Terminal = free tier + Pro for SQL/API.
Q: How often should I check? A: Weekly for active supply/holder trends (rwa.xyz). Monthly for financials (The Block). Quarterly for valuation (Token Terminal).
Q: What about Dune Analytics? A: Dune is the customization layer. Use it when the four platforms don't have your exact view. Most analysts use Dune + the four platforms.
Q: How do I track new RWA launches? A: rwa.xyz "New Assets" feed (updated daily) + The Block "RWA Deal Tracker" (weekly) + DeFiLlama "New Protocols" RSS.
Q: Can I use these for compliance reporting? A: rwa.xyz CSV export + The Block financials = audit-ready data package. Token Terminal SQL for custom reports.
Summary: Your RWA Analytics Stack
| Need | Primary Tool | Backup |
|---|---|---|
| Discovery (what exists) | DeFiLlama | rwa.xyz Asset Explorer |
| Asset deep dive | rwa.xyz | The Block issuer page |
| Financial health (NAV, yield, fees) | The Block | Issuer reports direct |
| Valuation (multiples, comps) | Token Terminal | Manual comps from The Block |
| Custom analysis | Dune + APIs | CSV exports from all four |
The meta-skill: Knowing which question you're asking before you open a dashboard. The 4-Question Method saves hours of wrong-tool frustration.
Next steps: Set up your free accounts on all four platforms. Build a watchlist of 5-10 assets on rwa.xyz. Create a Dune dashboard combining your top metrics. Schedule weekly 30-min review sessions.
Keywords woven: RWA analytics (H1, first 100 words, H2s), dashboard (H2, body), market cap by asset class/chain/issuer (H2, H3), transfer volume (H3, body), TVL (body), active supply (body), holder count (body), utilization rate (implied), net flows (implied), API (body), SQL (body), CSV export (body).