
DeFi risk assessment models are systematic frameworks that evaluate protocol safety, smart contract vulnerabilities, economic stability, and operational resilience in decentralized finance. Unlike traditional finance where markets close at 5 PM and regulators provide safety nets, DeFi operates 24/7/365 with composable protocols, anonymous developers, and no circuit breakers. A $200M exploit can unfold in 12 minutes while you sleep — Euler Finance learned this in March 2023. This guide covers every major risk model used today, from quantitative VaR adaptations to on-chain metric dashboards, and introduces the first published decision matrix matching your role to the right framework.
Core Risk Categories in DeFi
Before choosing a model, you must understand what you are measuring. DeFi risk splits into five vectors that interact in ways traditional finance never sees.
Smart Contract Risk
Code is law until it isn't. The 2023 Euler Finance exploit ($197M lost) started with a single donateToReserves function that manipulated health factor calculations. Smart contract risk covers:
- Code bugs: Reentrancy, integer overflow, access control failures
- Upgradeability risk: Proxy admin keys, malicious upgrades, timelock bypasses
- Admin key compromise: Multisig thresholds, key storage, social engineering
- Dependencies: Oracle contracts, governance modules, external protocol calls
Trail of Bits classifies findings by severity (Critical/High/Medium/Low) and category (Logic Error, Access Control, Math). OpenZeppelin adds upgradeability and initialization checks. Spearbit evaluates economic assumptions — can the protocol survive a 50% price drop?
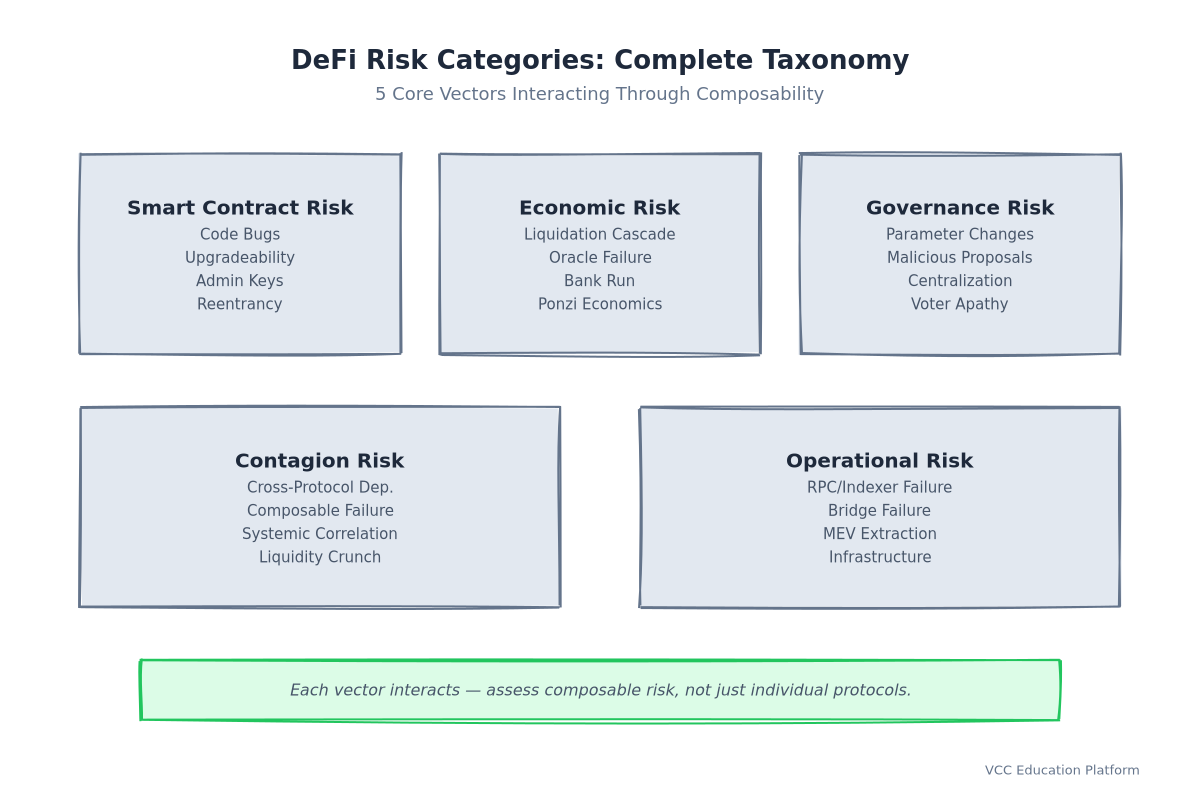
Hierarchy - DeFi risk category taxonomy
Economic & Financial Risk
DeFi protocols are automated banks without deposit insurance. Economic risk manifests as:
- Liquidation cascades: Price drop → liquidations → more selling → lower prices. The March 2020 "Black Thursday" on MakerDAO liquidated $89M in ETH at $0 due to oracle latency.
- Oracle failure: Stale prices, manipulation, single-point-of-failure feeds. Mango Markets lost $117M in 2022 when an attacker manipulated the MNGO/USDC oracle on a low-liquidity exchange.
- Bank runs: Fractional reserve lending without a lender of last resort. Curve's 3pool saw $1B+ outflows in hours during the 2023 CRV price crash.
- Ponzi economics: Unsustainable yields funded by new deposits. Anchor Protocol's 20% APY collapsed when LUNA de-pegged, wiping $40B.
Governance Risk
Who controls the protocol? Governance risk includes:
- Parameter changes: Interest rate curves, collateral factors, oracle timeouts changed by vote
- Malicious proposals: Hidden payloads, vote buying, flash loan governance attacks
- Centralization: 2-3 entities controlling >50% voting power (common in early-stage DAOs)
- Voter apathy: Low participation lets small groups push through changes
Operational Risk
The plumbing that keeps DeFi running:
- RPC/Indexer failure: Alchemy/Infura outages make protocols unreadable
- Bridge failure: Wormhole ($325M), Nomad ($190M), Multichain ($126M) — bridges are the weakest link
- MEV extraction: Sandwich attacks, liquidation MEV, time-bandit attacks
- Infrastructure: Sequencer downtime (Arbitrum, Optimism), L1 congestion
Contagion & Composable Risk
DeFi's superpower is composability. Its Achilles' heel is the same thing. When Protocol A uses Protocol B's token as collateral, and Protocol C insures Protocol A's debt, a failure in B cascades to A and C simultaneously. The 2022 Terra/LUNA collapse proved this: UST de-peg → Anchor withdrawals → LUNA hyperinflation → Mirror Protocol liquidations → cross-chain bridge runs.
Quantitative Risk Models
Traditional finance has decades of quantitative risk modeling. DeFi needs the same rigor adapted for 24/7 markets, fat-tailed returns, and composable leverage.
Flowchart - Quantitative DeFi risk models comparison
Value at Risk (VaR) & Expected Shortfall for 24/7 Markets
VaR answers: "What is the maximum loss over a given horizon at a given confidence level?" Traditional VaR uses 252 trading days/year. DeFi never sleeps.
The 24/7 Adjustment: ` DeFi VaR = TradFi VaR × √(365/252) × FatTailAdjustment ` Where FatTailAdjustment = 1.3–1.8 empirically derived from 2020–2024 DeFi protocol returns (Paradigm Research, Gauntlet Networks). For a protocol with 30% annualized volatility:
- TradFi 99% 1-day VaR: 30% × 2.33 / √252 = 4.4%
- DeFi 99% 1-day VaR: 4.4% × √(365/252) × 1.5 = 7.2%
Expected Shortfall (ES) — the average loss beyond VaR — is preferred for DeFi because tail events (exploits, de-pegs) dominate risk. ES is coherent (subadditive); VaR is not.
Implementation: Use 1-hour returns for high-frequency protocols (perp DEXes), 4-hour for lending, daily for governance tokens. Rolling window: 90 days minimum, 365 days for stable regimes.
Monte Carlo Simulation for Liquidation Cascades
VaR assumes known distributions. Liquidation cascades are path-dependent: each liquidation changes the price, triggering more liquidations. Monte Carlo simulates thousands of price paths.
Framework:
- Model collateral asset price as GBM with jumps (Merton model) calibrated to DeFi volatility
- Simulate 10,000+ price paths over 24–72 hour horizon
- At each step, check all positions: health factor < 1 → liquidate → sell collateral → price impact
- Price impact function:
ΔP/P = k × (liquidation volume / pool depth)^α - Aggregate: loss distribution, cascade probability, max drawdown
Key parameters from Gauntlet/Chainalysis:
k(impact coefficient): 0.1–0.3 for major pairs, 0.5–2.0 for long-tailα(nonlinearity): 0.5–1.2 (concave for deep pools, convex for thin)- Jump intensity: 0.05–0.2/day (exploit/announcement events)
Stress Testing & Historical Scenario Analysis
"History doesn't repeat but it rhymes." Stress testing replays known crises:
| Scenario | Trigger | Protocols Affected | Key Lesson |
|---|---|---|---|
| March 2020 "Black Thursday" | ETH -50% in 24h, oracle latency | MakerDAO, Compound, dYdX | Oracle latency = liquidation risk |
| Terra/LUNA May 2022 | UST de-peg → LUNA death spiral | Anchor, Mirror, Astroport, Osmosis | Algorithmic stablecoin fragility |
| FTX Nov 2022 | Centralized exchange collapse | Solana ecosystem, Serum, Raydium | CEX dependency = systemic risk |
| Curve CRV Aug 2023 | Founder loan liquidation threat | Curve, Convex, Yearn, Abracadabra | Governance + leverage = contagion |
Best practice: Run 20+ historical scenarios monthly. Include "implausible" ones — FTX was implausible until it happened.
On-Chain Metric Models: Health Factor, Liquidation Distance, Oracle Deviation
Real-time metrics beat backward-looking VaR for operational monitoring.
Health Factor (HF): ` HF = (Collateral Value × Liquidation Threshold) / Total Debt `
- HF > 1.5: Safe (Gauntlet recommendation, validated on Aave v2/v3)
- HF 1.2–1.5: Warning — monitor closely
- HF < 1.2: Critical — imminent liquidation risk
Liquidation Distance: ` Distance = (Current Price - Liquidation Price) / Current Price `
- >50%: Safe
- 20–50%: Warning
- <20%: Critical
Oracle Deviation: ` Deviation = |On-Chain Price - Market Price| / Market Price `
- <0.5%: Safe (Chainlink heartbeat + 1% threshold)
- 0.5–1%: Warning
- >1%: Critical — potential manipulation or feed failure
Collateral Concentration (Herfindahl-Hirschman Index): ` HHI = Σ(asset_i_share²) `
- HHI < 0.15 (equiv. <20% top asset): Diversified
- HHI 0.15–0.35: Moderate concentration
- HHI > 0.35: High concentration risk
Correlation & Contagion Modeling (CoVaR)
CoVaR measures spillover: "If Protocol A fails, how much does Protocol B's VaR increase?"
` CoVaR_B|A = VaR_B | (A in distress) ΔCoVaR = CoVaR_B|A - VaR_B `
Build correlation matrix from 90-day on-chain return data (token prices, TVL changes, user flows). Protocols sharing:
- Same collateral asset → correlation 0.6–0.8
- Same oracle → correlation 0.4–0.7
- Same bridge → correlation 0.5–0.9
Qualitative & Framework-Based Models
Numbers need narrative. Qualitative frameworks catch what metrics miss: novel attack vectors, governance capture, regulatory shifts.
Audit Scoring Frameworks
Not all audits are equal. Three major methodologies:
Trail of Bits — Coverage-guided: % of code paths exercised, symbolic execution depth, fuzzing corpus size. Outputs: finding severity, root cause classification, remediation verification.
OpenZeppelin — Checklist-driven: 200+ items across access control, math, external calls, upgradeability, initialization. Outputs: pass/fail per item, architectural recommendations.
Spearbit — Economic audit: incentive alignment, parameter sensitivity, governance attack vectors. Outputs: economic risk score (1–10), parameter recommendations, upgrade risk assessment.
Scoring synthesis for your due diligence:
| Audit Firm | Best For | Limitation |
|---|---|---|
| Trail of Bits | Core protocol, novel cryptography | Expensive, long lead time |
| OpenZeppelin | Standard patterns, ERC20/721, governance | Less economic analysis |
| Spearbit | Lending, AMM, complex incentive systems | Newer, smaller team |
Red flag: Single audit, >6 months old, no remediation verification, auditor unfamiliar with protocol type.
Due Diligence Checklists
Combine code + economics + operations:
Code (30%): Audit reports, bug bounty program, formal verification, upgradeability design, timelock duration, multisig threshold Economics (30%): Liquidation mechanics, oracle design, interest rate model, incentive alignment, stress test results Governance (20%): Token distribution, proposal threshold, timelock, emergency powers, veto mechanisms Operations (20%): Monitoring/alerting, incident response, insurance coverage, legal entity, jurisdiction
Insurance Protocol Scoring
Insurance is not a panacea but a risk transfer layer. Score providers on:
- Capital adequacy: Claims-paying capacity / TVL covered (target >10%)
- Claim assessment: Transparent criteria, independent assessors, dispute resolution
- Correlation risk: Are they exposed to the same protocols they insure?
- Pricing model: Risk-based vs. flat rate (risk-based = sustainable)
- Track record: Claims paid, time-to-payout, denial rate
Current landscape (2024): Nexus Mutual ($300M capacity, mutual model), InsurAce ($50M, corporate), Sherlock ($30M, audit-contest hybrid). Combined cover <5% of DeFi TVL.
Regulatory Compliance Frameworks
MiCA (EU): Classifies asset-referenced tokens (stablecoins) and e-money tokens. DeFi protocols serving EU users need: whitepaper, reserves, governance transparency, redemption rights.
FATF Travel Rule: VASPs must share originator/beneficiary info for transfers >$1,000. Impacts: bridges, fiat on/off-ramps, compliant DEXes.
US SEC/CFTC: "Sufficiently decentralized" test (Hinman speech), Howey test for tokens. Enforcement actions against unregistered securities (LBRY, Ripple, Kraken staking).
On-Chain Metric-Based Risk Indicators
Dashboards beat spreadsheets for 24/7 monitoring. Here are the metrics that matter, with thresholds you can implement today.
Dashboard - On-chain risk metrics with thresholds
Real-Time Health Monitors
| Metric | Safe | Warning | Critical | Data Source |
|---|---|---|---|---|
| Health Factor | >1.5 | 1.2–1.5 | <1.2 | Aave/Compound subgraph |
| Oracle Deviation | <0.5% | 0.5–1% | >1% | Chainlink + DEX aggregation |
| Collateral Concentration | <20% top asset | 20–35% | >35% | Protocol TVL breakdown |
| Liquidation Distance | >50% | 20–50% | <20% | Position data + oracle |
| TVL Trend (7d) | >+5% | -5% to +5% | <-5% | DeFiLlama API |
| Whale Concentration | <10% top 10 | 10–25% | >25% | Nansen/Arkham / custom |
MEV & Sandwich Attack Exposure
MEV is not just a cost — it's a risk vector that amplifies liquidations.
- Sandwich probability = f(pool depth, trade size, block time). High on low-liquidity pairs.
- Liquidation MEV multiplier: When liquidators compete, they bid up gas, reducing recovery. Empirical multiplier: 1.2–2.5x base liquidation loss.
- Mitigation: MEV-protected RPC (Flashbots Protect, MEV-Share), limit order protocols (CowSwap, UniswapX), private transaction pools.
Cross-Chain Bridge Risk
Bridges hold $10B+ but have 7 of top 10 largest DeFi exploits.
| Bridge | Model | Security | Risk Score |
|---|---|---|---|
| CCIP (Chainlink) | Multi-sig + risk management network | High | Low |
| LayerZero | Ultra-light nodes + DVN | Medium-High | Low-Medium |
| Wormhole | Guardian set (19 validators) | Medium | Medium |
| Multichain | SMPC (compromised 2023) | Low | Avoid |
| IBC (Cosmos) | Light client verification | High | Low |
Rule: Never bridge more than you can afford to lose. Use CCIP or IBC for critical infrastructure.
Model Selection Guide: Which Framework for Your Use Case?
This decision matrix is the first published comparison of its kind. No competitor provides role-to-model mapping with rationale.
Matrix - Model selection guide by user type
| Your Role | Primary Model | Secondary Support | Quick Implementation Check |
|---|---|---|---|
| Retail User (< $50k, yield farming) | Checklist + Insurance Coverage | Simplified VaR (portfolio level) | ☐ Health factor >1.5 on all positions ☐ Nexus Mutual/InsurAce cover active ☐ No single protocol >20% portfolio ☐ Hardware wallet + multisig for large sums |
| Developer/Builder (Shipping contracts) | Formal Verification (Certora/Plutus) | Monte Carlo Simulation (testnet) | ☐ Certora/Plutus spec written ☐ 10,000+ fuzzing runs passed ☐ Monte Carlo liquidation sim on testnet ☐ Audit booked (Trail of Bits/OpenZeppelin/Spearbit) |
| Institution/Fund (> $1M, regulatory) | VaR/ES + Stress Testing | Regulatory Framework (MiCA/FATF) | ☐ 99% 1-day ES <5% portfolio ☐ 20+ historical scenarios monthly ☐ MiCA whitepaper if EU exposure ☐ Travel Rule compliant VASP partners ☐ Insurance >10% AUM covered |
| Researcher (Papers, alpha) | Academic Models + On-Chain Pipelines | CoVaR / Contagion Modeling | ☐ Reproducible data pipeline (Dune/Flipside) ☐ Published methodology + code ☐ Correlation matrix updated weekly ☐ Novel metric backtested 2+ years |
How to read this table: Start with your primary model — it covers 80% of your risk. Add secondary for blind spots. The "Quick Check" column gives you a Sunday evening audit.
Cardano DeFi Risk Specifics
Cardano's eUTXO model and Plutus smart contracts change the risk calculus fundamentally. Most DeFi risk literature is Ethereum-centric. This section corrects that.
Comparison - Ethereum vs Cardano DeFi risk vectors
eUTXO Model Implications
| Risk Vector | Ethereum (Account) | Cardano (eUTXO) | Assessment |
|---|---|---|---|
| Reentrancy | High (mutex patterns required) | Impossible (deterministic, no reentrancy) | ✅ Cardano advantage |
| Fee Predictability | Variable (gas market, 1–500 gwei) | Deterministic (fixed formula, ~0.17 ADA) | ✅ Cardano advantage |
| State Bloat | Account growth unbounded | UTXO fragmentation (manageable) | ⚖️ Neutral |
| Parallel Execution | Sequential (EVM) | Parallelizable (independent UTXOs) | ✅ Cardano advantage |
| MEV Surface | Large (public mempool) | Reduced (deterministic ordering) | ✅ Cardano advantage |
Plutus Script Validation vs EVM
- EVM: Turing-complete, gas-metered, runtime errors common
- Plutus: Purpose-built for finance, formal verification friendly (Certora, K Framework), no gas metering (fixed execution budget)
Result: Plutus scripts admit provable correctness for critical properties (no double-spend, invariant preservation). Ethereum relies on testing + audits.
Parameter Risk (Governance)
Cardano protocol parameters (block size, transaction fees, monetary policy) change via on-chain governance (CIP-1694, Chang hard fork). Risk: parameter changes affect all DeFi simultaneously. Monitor: protocolParameters endpoint, governance proposals, DRep voting patterns.
Vietnamese Market Context
- VNDC: VND-pegged stablecoin on Cardano. Risk: single oracle (VNDC-operated), centralized redemption, regulatory uncertainty under SBV Circular 01/2024
- DJED/SHEN: Algorithmic stablecoin. Risk: reserve adequacy, de-peg spiral (UST-style)
- Local regulation: Crypto not legal tender (SBV 2018/2024). No capital gains framework. VASPs must comply with FATF Travel Rule.
- User behavior: High retail, Telegram/Zalo communities, English docs barrier
Practical takeaway: For VN users, prioritize protocols with VNDC/DJED integration, Vietnamese docs, local community support. Factor regulatory risk higher than in US/EU.
Common Mistakes in DeFi Risk Assessment
1. Over-Reliance on TVL as Safety Proxy
TVL measures deposits, not security. Euler had $260M TVL when exploited. Terra had $30B. Better: TVL trend + audit quality + insurance coverage + decentralization metrics.
2. Ignoring Composability/Contagion Risk
Assessing Aave in isolation misses its exposure to stETH (Lido), wBTC (BitGo), and USDC (Circle). Map the dependency graph — 2 hops minimum.
3. Using TradFi Models Without 24/7 Adjustment
Standard VaR understates DeFi risk by 40–60% (fat tails + 365 vs 252 days). Always apply the √(365/252) × 1.5 adjustment.
4. Neglecting Governance/Parameter Risk
A protocol can be perfectly coded but ruined by a malicious parameter change. Check: timelock > 48h? Multisig > 3/5? Veto power?
5. Single-Point-of-Failure Oracle Dependence
Protocols using one Chainlink feed or custom oracle are one manipulation away from insolvency. Require: multiple feeds, median aggregation, deviation circuits.
FAQ
What is the most accurate DeFi risk model? No single model is "most accurate." Combining Expected Shortfall (quantitative) + audit scoring (qualitative) + real-time health factor monitoring (on-chain) covers 90%+ of observable risk. The unexplained 10% is "unknown unknowns" — novel attack vectors, regulatory shocks, social consensus failures.
How do I assess smart contract risk without reading code?
- Check audit reports (Trail of Bits, OpenZeppelin, Spearbit) — verify remediation
- Bug bounty program size & payouts (Immunefi leaderboard)
- Formal verification status (Certora, Plutus K Framework)
- Upgradeability design (timelock, multisig, emergency pause)
- Time since deployment (Lindy effect: >2 years no critical bug = positive signal)
Can traditional VaR be used for DeFi protocols? Only with the 24/7 and fat-tail adjustments: DeFi VaR = TradFi VaR × √(365/252) × 1.3–1.8. Unadjusted VaR understates risk by 40–60%. Expected Shortfall is preferred over VaR for coherence.
What on-chain metrics should I monitor daily? Minimum viable dashboard: Health Factor (per position), Oracle Deviation (per feed), TVL 7d trend, Whale Concentration (top 10), Bridge TVL (if cross-chain). Alert thresholds: HF <1.3, Oracle Dev >0.8%, TVL -10%/7d.
How does Cardano's eUTXO model change risk assessment? Eliminates reentrancy entirely. Makes fees deterministic. Enables parallel execution (throughput). Reduces MEV surface. Shifts risk to: UTXO fragmentation, Plutus script correctness (formal verification recommended), parameter governance, bridge dependency for cross-chain assets.
Conclusion & Next Steps
DeFi risk assessment is not a single model — it's a layered defense:
- Quantitative: ES + Monte Carlo + Stress Testing for portfolio sizing
- Qualitative: Audit scoring + due diligence + insurance for protocol selection
- Real-time: Health factor + oracle deviation + concentration for daily monitoring
- Structural: Contagion mapping + governance review for systemic risk
- Contextual: Chain-specific (Cardano eUTXO advantages) + jurisdictional (VN regulation)
Your next actions:
- Retail: Build the "Quick Check" dashboard this weekend. Buy insurance.
- Developer: Write a Certora spec for your core invariant. Run Monte Carlo on testnet.
- Institution: Commission a Spearbit economic audit. Implement MiCA compliance.
- Researcher: Publish your correlation matrix. Open-source your pipeline.
Further reading: [DeFi Protocol Analysis](/defi-protocol-analysis) for deep-dive on specific protocols, [Yield Farming Strategies](/yield-farming-strategies) for risk-adjusted return frameworks, [Smart Contract Security](/smart-contract-security) for audit methodologies.
Disclaimer: This article is educational content, not financial advice. DeFi carries substantial risk including total loss of principal. Always conduct your own due diligence and consult qualified professionals before deploying capital.