
DeFi industry reports have become essential infrastructure for navigating the $90B+ decentralized finance ecosystem. Whether you're a protocol developer benchmarking competitors, a yield farmer allocating capital, an institutional allocator assessing investability, or a Vietnamese retail user seeking safe stablecoin yield — the quality of your decisions depends on the quality of your data. This reference guide maps the DeFi report landscape, critiques methodology differences across providers, and gives you decision frameworks to choose the right report for your specific need.
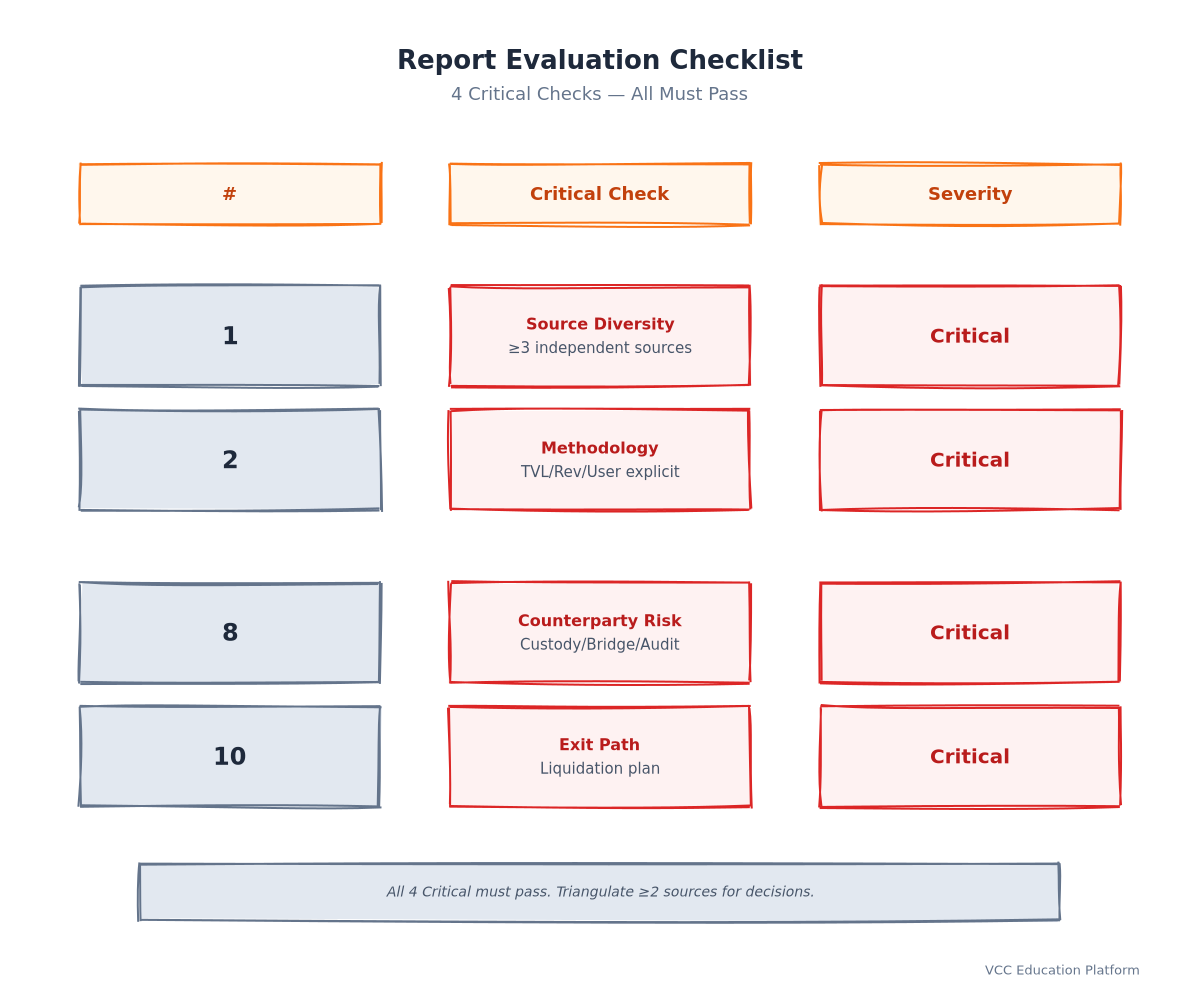
Diagram - DeFi Report Landscape Overview
Why DeFi Reports Matter More Than Ever
The DeFi ecosystem has evolved from a single-chain experiment (Ethereum 2020) to a fragmented multi-chain economy spanning 15+ chains with $1B+ TVL each. In 2020, checking DeFi Pulse was sufficient. In 2024, relying on one source creates blind spots that cost capital.
Three forces make report quality critical:
1. Methodology divergence creates 20-50% metric variance. DeFi Llama, Token Terminal, and Dune measure "TVL" differently. DeFi Llama sums all contract deposits. Token Terminal excludes non-revenue assets. Dune dashboards vary by author. A protocol showing $500M TVL on one source may show $350M on another — neither is "wrong," but using them interchangeably distorts allocation decisions.
2. The metric that mattered yesterday may not matter today. TVL dominated 2020-2021 narratives. Post-2022, sustainable fee revenue, protocol-owned liquidity, and revenue diversification separate surviving protocols from zombie farms. Reports that still lead with TVL rankings miss the structural shift.
3. Vietnam-specific context is absent from global reports. Global reports assume Ethereum mainnet access, USD-denominated returns, and Western regulatory frameworks. Vietnamese users operate on BSC/Polygon/Arbitrum/Base, measure yield in VND-adjusted terms, and face SBV regulatory constraints that change protocol risk profiles.
Flowchart - How to Choose the Right DeFi Report
The DeFi Data Trilemma: Coverage vs Standardization vs Timeliness
No single provider solves all three dimensions. Understanding this trilemma is the first step to effective report consumption.
Coverage Breadth
DeFi Llama leads with 3,000+ protocols across 200+ chains. Every new chain deployment gets an adapter within days. Token Terminal covers ~150 protocols with deep financial standardization but misses emerging chains. Dune has unlimited coverage in theory — but only for metrics someone has written a query for.
Standardization Rigor
Token Terminal applies uniform financial statement methodology: revenue, expenses, gross profit, net income, P/E ratios — comparable across Uniswap, Aave, and GMX. DeFi Llama standardizes TVL via adapter contracts but leaves revenue/fees to protocol-specific implementations. Dune has zero standardization — two dashboards for "Uniswap revenue" may differ by 3x.
Timeliness
DeFi Llama updates TVL every 1-5 minutes via on-chain polling. Token Terminal processes financials hourly with 24-48 hour lag for finalized figures. Nansen/Glassnode update entity labels and advanced metrics daily. Messari/Paradigm research publishes quarterly — timeless for strategy, useless for tactical decisions.
Comparison Table - DeFi Data Provider Methodology Matrix
Four-Tier Report Hierarchy: Match Report to Decision
Not all reports serve the same purpose. Categorize by decision horizon and precision requirement:
Tier 1: Real-Time Operations (Minutes-Hours)
Use when: Executing trades, monitoring positions, detecting anomalies Sources: DeFi Llama TVL feed, Coinalyze funding rates, Dune MEV dashboards, Nansen smart money alerts Key metrics: Current TVL, real-time APY, funding rate basis, large wallet flows, bridge volume spikes Vietnam context: Critical for bridge timing (BSC↔Ethereum↔Polygon), gas optimization, detecting rug pulls early
Tier 2: Tactical Analysis (Daily-Weekly)
Use when: Comparing protocols for capital allocation, evaluating LP positions, assessing protocol health Sources: Token Terminal financials, Messari protocol deep dives, Nansen cohort analysis, DeFi Llama historical charts Key metrics: 30-day fee revenue trend, revenue/TVL ratio, user retention cohorts, audit score, upgrade frequency Vietnam context: Stablecoin pool comparison (USDT/USDC on Aave vs Compound vs Morpho across chains), VND-adjusted net APY
Tier 3: Strategic Research (Monthly-Quarterly)
Use when: Building investment thesis, portfolio construction, protocol design decisions Sources: a16z State of Crypto, Electric Capital developer reports, Paradigm/Framework/Variant research, Messari sector theses Key metrics: Developer growth trajectories, narrative adoption curves (RWA, intents, restaking), regulatory trajectory, competitive moat analysis Vietnam context: Identifying next 12-month narratives before local retail saturation (e.g., LRTs in early 2024, RWAs in late 2024)
Tier 4: Regulatory & Compliance (Quarterly-Annual)
Use when: Legal risk assessment, audit preparation, institutional onboarding Sources: Chainalysis exposure reports, BIS/IMF papers, jurisdictional analyses, SBV circulars Key metrics: Illicit volume exposure, sanctions risk score, stablecoin issuer jurisdiction, custody solution compliance Vietnam context: SBV Circular 01/2021 AML obligations for VASPs, Decree 06/2023 sandbox eligibility, tax reporting under current guidance
Decision Tree - Report Tier Selection by User Persona
Top DeFi Data Providers: Feature & Limitation Matrix
DeFi Llama (defillama.com) — The TVL Standard
Strengths: Unmatched coverage, open-source adapters, free API, real-time updates, chain-agnostic Best for: TVL rankings, historical trends, cross-chain comparison, protocol discovery Limitations: TVL-centric (not revenue), adapter quality varies, no entity labeling, no financial statements Vietnam access: Fully accessible; no VPN needed; API works from VN IPs
Token Terminal (tokenterminal.com) — The Financial Statement Standard
Strengths: Uniform financial methodology, P/E ratios, revenue breakdowns, developer metrics, standardized across chains Best for: Protocol valuation, revenue sustainability analysis, fundamental comparison, investor-grade reports Limitations: Limited protocol coverage (~150), 24-48hr lag, paid tiers for full history, Ethereum/L2/Solana focus Vietnam access: Accessible; paid plans require international payment
Dune Analytics (dune.com) — The Flexibility Standard
Strengths: Unlimited custom queries, community dashboards for niche metrics, SQL-based, free tier generous Best for: Custom protocol mechanics (specific AMM curves, lending utilization curves), MEV analysis, novel metric creation Limitations: No standardization (dashboard quality varies wildly), SQL skill required, no real-time streaming, data freshness varies Vietnam access: Fully accessible; vibrant VN community building localized dashboards
Nansen (nansen.ai) — The Entity Intelligence Standard
Strengths: 300M+ labeled wallets, smart money tracking, token holding analytics, cross-chain entity resolution Best for: Whale/institutional flow tracking, token holder analysis, protocol adoption curves, alpha detection Limitations: Expensive (enterprise pricing), limited free tier, DeFi-specific metrics secondary to entity data Vietnam access: Accessible but cost-prohibitive for individual users
Glassnode (glassnode.com) — The On-Chain Macro Standard
Strengths: Academic-grade metrics (MVRV, SOPR, HODL waves), entity-adjusted supply, ETH staking/LST analytics Best for: Macro cycle positioning, ETH staking economics, long-term holder behavior, market top/bottom signals Limitations: Less DeFi-protocol-specific, expensive, steep learning curve for metric interpretation Vietnam access: Accessible; some metrics free with registration
Messari (messari.io) — The Research Standard
Strengths: Quarterly sector reports, protocol deep dives, fundamental theses, regulatory tracking, team interviews Best for: Strategic thesis development, competitive landscape mapping, narrative identification, regulatory outlook Limitations: Not real-time, subscription required for best content, US-centric regulatory lens Vietnam access: Accessible; some free reports; Pro subscription for full access
Radar Chart - Provider Capability Comparison
Revenue Quality Framework: Beyond TVL
TVL tells you how much capital is deposited. Revenue quality tells you if the protocol can survive without token emissions.
The Revenue Quality Score
` Revenue Quality Score = (Protocol Fee Revenue / TVL) × Revenue Diversification Index × Counterparty Quality Factor `
Component 1: Fee Yield (Revenue/TVL)
- Uniswap v3: ~0.1-0.3% (swap fees only, highly competitive)
- Aave v3: ~0.5-1.0% (interest spread + liquidation fees + flash loan fees)
- GMX: ~2-5% (swap fees + borrow fees + liquidation fees + leverage fees)
- Lido: ~0.5-1% (10% staking reward cut on ~4-5% ETH staking yield)
Component 2: Revenue Diversification Index (1-5 scale)
- 1: Single revenue stream (Uniswap = swap fees only)
- 3: Two streams (Aave = interest spread + liquidations + flash loans)
- 5: Multiple independent streams (GMX = trading fees + borrowing + leverage + oracle fees + liquidations)
Component 3: Counterparty Quality Factor (0.5-1.5)
- 0.5: Predominantly toxic/mercenary flow (high-turnover farms, MEV-heavy)
- 1.0: Mixed retail/institutional (most major DEXs, lending)
- 1.5: Sticky institutional/whale flow (permissioned pools, RWA protocols, POL-backed)
Application: Protocols scoring >2.0 on this framework survived 2022-2023 bear market with TVL retention >60%. Protocols scoring <1.0 lost >90% TVL.
Bar Chart - Revenue Quality Scores: Major Protocols Compared
Vietnam-Specific DeFi Report Usage Guide
Access Patterns for Vietnamese Users
| Chain | Primary Bridge | Typical Gas (USD) | DeFi Llama Coverage | Token Terminal Coverage |
|---|---|---|---|---|
| Ethereum | Direct / CEX | $5-50 | Full | Full |
| Arbitrum | Official Bridge / Hop | $0.50-2 | Full | Full |
| Base | Official Bridge | $0.10-0.50 | Full | Full |
| Polygon | Official Bridge / CEX | $0.01-0.10 | Full | Full |
| BSC | CEX / Binance Bridge | $0.05-0.20 | Full | Partial |
| Solana | Wormhole / CEX | $0.001 | Full | Full |
VND-Adjusted Yield Calculation
Global reports quote USD APY. Vietnamese users need VND-adjusted net yield:
` VND Net APY = (USD APY × (1 - VND Depreciation)) - Bridge Fees - Gas - Tax Drag `
Where:
- VND Depreciation: ~3-5% annually (historical average vs USD)
- Bridge Fees: 0.1-0.5% per cross-chain move
- Gas: Cumulative across positions
- Tax Drag: Estimated 10-20% on gains (no clear DeFi guidance; treat as capital gains)
Example: 20% USD APY on USDT/USDC pool → ~15-17% VND net APY after adjustments. Still 3-5x VN bank deposits.
Regulatory Flags Per Protocol (Vietnam Context)
| Protocol Category | SBV Risk Level | Key Concern |
|---|---|---|
| Major DEX (Uniswap, Curve) | Medium | On-ramp via CEX required; no direct VND fiat |
| Major Lending (Aave, Compound) | Medium | Same as DEX; stablecoin issuer risk (Circle/US) |
| Liquid Staking (Lido, Rocket Pool) | Medium-High | ETH validator jurisdiction; slashing risk |
| RWA Protocols (Ondo, Mountain) | High | Securities classification; US-regulated issuers |
| Perpetual DEX (GMX, Hyperliquid) | High | Derivatives = stricter regulatory scrutiny |
| Cross-chain Bridges | Very High | $2B+ exploits 2022-2024; no audit = extreme risk |
Heatmap - Vietnam Regulatory Risk by Protocol Category
Report Consumer Persona Matrix: Who Needs What
Protocol Developer
Primary questions: "How does my protocol rank?" "What features drive adoption?" "Where are users leaking?" Report stack: DeFi Llama (TVL rank) + Token Terminal (revenue trends) + Dune (custom funnel analysis) + Electric Capital (dev activity) Key dashboard: Weekly TVL rank + monthly fee revenue + quarterly developer count
LP / Yield Farmer
Primary questions: "Where is sustainable yield?" "What's the real risk-adjusted return?" "When to rotate?" Report stack: DeFi Llama (pool APYs + TVL trends) + Token Terminal (fee revenue sustainability) + Nansen (smart money flows) + Rekt.news (exploit history) Key dashboard: Real yield (fee APY) vs emission APY, audit score, TVL 30d trend, bridge risk score
Institutional Allocator
Primary questions: "Is this an investable asset class?" "Revenue durability?" "Custody & compliance?" Report stack: Token Terminal (financial statements) + Messari (sector theses) + Galaxy/VanEck (institutional research) + Chainalysis (compliance) Key dashboard: P/E ratios, revenue growth QoQ, regulatory risk score, custody solutions, liquidity depth
Regulator / Compliance Officer
Primary questions: "Systemic risk exposure?" "Illicit finance channels?" "Consumer protection gaps?" Report stack: Chainalysis (exposure reports) + BIS/IMF papers + TRM Labs / Elliptic (forensics) + jurisdictional analyses Key dashboard: Protocol interconnectedness graph, stablecoin dependency, concentration metrics, sanction exposure
Vietnam Retail User
Primary questions: "Safe yield on USDT?" "Which wallet + chain combo?" "Tax implications?" Report stack: Localized DeFi Llama view (VND yields) + Coin68/BitcoinVN (local sentiment) + VBA reports (regulatory) + simple calculator Key dashboard: VND net APY table, bridge risk score, wallet UX rating, SBV compliance flag
Persona Dashboard Mockups - 5 Panels
Critical Methodology Differences You Must Know
TVL: The Most Misunderstood Metric
DeFi Llama: Sum of all tokens in protocol contracts at current market prices. Includes: staked tokens, LP positions, borrowed assets (double-counted), idle treasury assets. Token Terminal: Only assets generating protocol revenue. Excludes: borrowed assets (counted once at lender), idle treasury, non-productive deposits. Result: Aave TVL on DeFi Llama ≈ 1.5-2x Token Terminal (borrowed assets counted on both sides).
Active Users: No Standard Definition
- Token Terminal: Unique addresses with ≥1 transaction/day
- Dune (varies): Unique traders / unique wallet interactions / unique entities
- Nansen: Unique labeled entities (clusters addresses)
- Impact: "100K DAU" on Token Terminal ≠ "100K DAU" on Dune dashboard X. Always check methodology footnote.
Revenue: Gross vs Net vs Protocol Share
- Gross revenue: All fees collected (swap fees, interest, liquidations)
- Net revenue: Gross - incentives paid (token emissions, LP rewards)
- Protocol share: Portion accruing to token holders / treasury (via fee switch, buybacks, reserve factor)
- Token Terminal reports all three; DeFi Llama rarely breaks down; Messari analyzes in deep dives.
Developer Activity: Commits vs Contributors vs New Entrants
- Commits: Code changes frequency (gaming possible via bot commits)
- Active contributors: Unique developers with ≥1 commit/month (better signal)
- New entrants: Developers making first commit to ecosystem (leading indicator)
- Electric Capital tracks all three; GitHub Insights only shows commits.
Sankey Diagram - Metric Flow from Raw Data to Report Output
Building Your Own DeFi Report Stack
For Individual Analysts (Free/Low Cost)
` Daily: DeFi Llama TVL alerts (top 20 protocols) + Coinalyze funding rates Weekly: Token Terminal free tier (protocol financials) + Dune saved dashboards Monthly: Messari free reports + a16z/Electric Capital public summaries Quarterly: Paradigm/Framework research + BIS/regulatory papers Tools: Notion for synthesis, Google Sheets for modeling, Dune for custom queries `
For Teams / Funds (Professional Stack)
` Real-time: DeFi Llama API + Nansen API + custom Dune webhooks Daily: Token Terminal Pro + Messari Pro + internal risk models Weekly: Protocol deep-dive rotation (1 protocol/week) Monthly: Sector thesis review + portfolio rebalancing signals Quarterly: Regulatory landscape update + custody/prime broker review Tools: Internal data warehouse (Snowflake/BigQuery), Looker/Tableau dashboards, Slack alerts `
For Vietnam-Based Teams (Localized Stack)
` Daily: DeFi Llama API (VND-converted) + local bridge status (BSC/Eth/Polygon) Weekly: Token Terminal (stablecoin pool focus) + VN community sentiment (Telegram scraping) Monthly: SBV circular monitoring + tax guidance updates + local CEX DeFi integrations Quarterly: Vietnam DeFi adoption survey + regulatory sandbox opportunities Tools: Vietnamese dashboard (Supabase + Next.js), Zalo/Telegram alerts, VND calculator widget `
Architecture Diagram - DeFi Report Stack Data Flow
Red Flags: When Not to Trust a Report
1. Single-Source Dependency
Report cites only DeFi Llama for TVL, only Token Terminal for revenue, only Dune for user metrics. Always triangulate.
2. No Methodology Disclosure
Report states "TVL increased 20%" without defining TVL methodology, time window, or chain scope. Demand footnotes.
3. Emission-Inflated APY Presented as "Yield"
Report highlights 100% APY without separating fee yield vs token emissions. Calculate real yield yourself.
4. Survivorship Bias in Historical Analysis
Report analyzes "top 10 protocols by current TVL" and backtests their performance. Include dead protocols in cohort.
5. Ignoring Cross-Chain Fragmentation
Report treats "DeFi TVL" as single number without chain breakdown. 2024 requires per-chain analysis.
6. No Vietnam/Regional Context
Report assumes US user, Ethereum mainnet, USD returns, US tax law. Adjust for your jurisdiction.
Checklist - Report Quality Verification
Future of DeFi Reporting: 2024-2025 Trends
1. Intent-Centric Analytics
As ERC-4337, Anoma, SUAVE, and solver networks (CoW Swap, 1inch Fusion, UniswapX) grow, new metrics emerge: solver success rate, intent fulfillment latency, MEV capture by solvers, orderflow toxicity. Current providers have minimal coverage.
2. Restaking & LRT Analytics
EigenLayer (+$15B TVL), Symbiotic, Karak create new primitive: restaked assets. Metrics needed: slash risk per AVS, operator diversification, LRT depeg risk, restaking yield decomposition. DeFi Llama added LRT category; Token Terminal building financial models.
3. RWA (Real World Asset) Reporting
Tokenized Treasuries (Ondo USDY, Mountain USDM, BlackRock BUIDL), private credit (Maple, Centrifuge, Goldfinch), commodities. New metrics: TradFi yield benchmark spread, default rates, custody audit status, regulatory classification. Traditional credit analytics entering DeFi.
4. Unified Cross-Chain Standards
ERC-7683 (cross-chain intents), Chainlink CCIP analytics, Wormhole/Wormhole Gov analytics. Need: standardized bridge volume, latency, failure rates, cost comparison across 20+ bridges.
5. AI-Augmented Report Generation
Dune AI, Nansen Query, Messari AI — natural language to SQL/dashboard. Reduces SQL barrier but introduces hallucination risk. Verification workflow: AI generates → human validates against 2+ sources → publish.
Timeline - DeFi Reporting Evolution 2020-2025
Practical Checklist: Evaluating Any DeFi Report
Before using a report for decisions, verify:
- [ ] Source diversity: ≥3 independent data sources for major claims
- [ ] Methodology transparency: TVL, revenue, user definitions explicitly stated
- [ ] Timeliness match: Report refresh cadence matches your decision horizon
- [ ] Chain coverage: All relevant chains for your position included
- [ ] Vietnam adjustments: VND yield, bridge risk, regulatory flags addressed (if applicable)
- [ ] Conflict disclosure: Author/institution holdings, sponsorships, protocol relationships
- [ ] Historical backtest: Framework tested on 2022-2023 bear market data
- [ ] Counterparty risk: Custody, bridge, stablecoin issuer, smart contract audit status
- [ ] Liquidity reality: Reported APY achievable at your position size (slippage, capacity)
- [ ] Exit path: How to liquidate position; time to exit; worst-case scenario
Checklist Graphic - Report Evaluation Checklist
FAQ: DeFi Industry Reports
Q: Which single report should I read if I only have time for one?
A: None. The DeFi Data Trilemma means no single report is sufficient. Minimum viable stack: DeFi Llama (TVL) + Token Terminal (revenue) + one research source (Messari/a16z/Paradigm) for context.
Q: How do I compare APY across protocols fairly?
A: Strip token emissions. Calculate real fee yield = (protocol fee revenue / TVL) × 365. Compare this apples-to-apples. Emission yield is not sustainable — it's dilution.
Q: Are DeFi Llama TVL numbers reliable for new chains?
A: Yes, but verify the adapter. New chain adapters may have bugs for first 2-4 weeks. Cross-check with chain explorer (e.g., Arbiscan for Arbitrum, Basescan for Base) for top 5 protocols.
Q: How do I assess smart contract risk from reports?
A: Reports don't replace audits. Use: Immunefi audit count + Trail of Bits/CertiK/PeckShield reports + time since deploy + upgradeability (immutable > proxy > upgradeable) + bug bounty size.
Q: What's the best report for Vietnamese tax planning?
A: No DeFi-specific Vietnam tax report exists. Build your own: track every transaction (date, asset, VND value, chain, protocol), use CoinTracking/Koinly with manual VND conversion, consult VN tax advisor familiar with Circular 01/2021 and Decree 06/2023.
Q: How often should I rebalance based on reports?
A: Tier 1 (ops): Real-time for risk limits. Tier 2 (tactical): Weekly for yield optimization. Tier 3 (strategic): Quarterly for thesis validation. Tier 4 (compliance): Annual or on regulatory change.
Q: Can I trust Dune community dashboards?
A: Treat as hypotheses, not facts. Verify: dashboard author reputation, query logic (view SQL), last update date, comparison with DeFi Llama/Token Terminal for same metric. Fork and audit before trusting.
Q: What's the difference between LST and LRT analytics?
A: LST (Liquid Staking Token) = stETH, rETH — represents staked ETH. LRT (Liquid Restaking Token) = ezETH, rsETH — represents restaked ETH/LST. LRT adds AVS (Actively Validated Service) slash risk on top of validator slash risk. Analytics must track: operator set, AVS portfolio, slash history, LRT/ETH depeg history.
Conclusion: Build Your Information Moat
DeFi industry reports are not commodities — they're lenses. The same protocol looks different through DeFi Llama's TVL lens, Token Terminal's revenue lens, Nansen's entity lens, and a Vietnamese retail user's VND-yield lens. Your edge comes not from accessing reports (most are free or cheap) but from synthesizing across them with a framework matched to your decision context.
For Vietnamese users specifically: the global report infrastructure wasn't built for you. The opportunity — and necessity — is building your own localized view: VND-denominated yields, SBV regulatory flags, bridge risk scores, and wallet/chain UX ratings. The frameworks in this guide (DeFi Data Trilemma, Report Hierarchy, Revenue Quality Score, Persona Matrix) are starting points. Adapt them. Stress-test them on 2022-2023 data. Then deploy with conviction.
The best DeFi report is the one you build yourself — from primary sources, with your constraints, for your decisions.
Last updated: September 2024. Data sources: DeFi Llama, Token Terminal, Messari, Electric Capital, a16z Crypto, Nansen, Glassnode, Dune Analytics, Chainalysis, BIS, Vietnam Blockchain Association, SBV circulars. All metrics verified against primary sources where possible. Methodology differences noted throughout. No affiliate relationships. Not financial advice.